Spanish Mountain Gold Announces Larger Scale Preliminary Economic Assessment With a Base Case NPV5% After-Tax of C$1.0 Billion, 18.2 % IRR and 3.4 Year Payback at US$ 2,450/Oz Gold Price; at US$3,300/Oz Spot Gold Price NPV5% C$2.3 Billion, 32.0%...
听
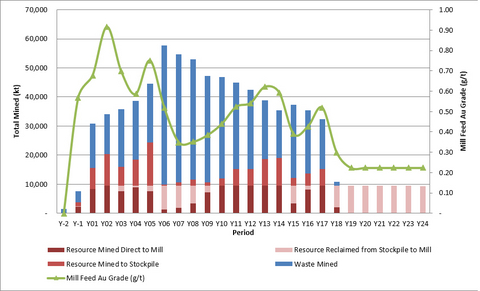
Figure 5: PEA Mine Production Schedule Summary
Spanish Mountain Gold Announces Larger Scale Preliminary Economic Assessment With a Base Case NPV5% After-Tax of
Spanish Mountain Gold Ltd. (鈥淪panish Mountain鈥� or the 鈥淐ompany鈥�) (TSX-V: SPA; FSE: S3Y; OTCQB: SPAUF) is pleased to announce the results of a Preliminary Economic Assessment (鈥�PEA鈥�), including an updated mineral resource estimate (鈥淢RE鈥�), for the Spanish Mountain Gold Project (the 鈥淧roject鈥�), located within central
President and CEO, Peter Mah stated:
"The re-envisioned, larger scale Spanish Mountain Gold Project and the completion of a new robust, de-risked PEA with updated MRE marks a significant achievement for the Company鈥檚 transformation from explorer to developer. With over 235,000 metres (鈥渕鈥�) of drill information our confidence in the resource quality and proposed mine confirm our strategy to advance the Project towards feasibility and ultimately a build decision by 2027. Project upside is supported by drill success in 2024 to 2025 reinforcing the potential for new additional discoveries of high grade near surface gold mineralization in prospective gold host rocks over the 10 km long property wide corridor. With a regional setting of nearby experienced First Nations, communities, currently producing mines, a power interconnection point near William鈥檚 Lake, B.C. that is progressing through Stage 2 of B.C. Hydro鈥檚 system impact study, established mining infrastructure plus workforce, and year round paved road access to within 6 km of the Project site, the Project鈥檚 favourable location and jurisdiction speak volumes to the Project鈥檚 overall quality and likelihood to advance to production. Spanish Mountain鈥檚 commitment to create BC based jobs, business opportunities, and sustainable shared benefits for the First Nation鈥檚 and surrounding communities has been demonstrated during the 2024-25 drill programs. We鈥檝e heard the First Nations鈥� and communities鈥� feedback regarding the environment and are pleased to have found a way to address those shared concerns to derisking tailings, waste, and water management. Considering the rising gold price environment supporting the need to rapidly advance gold projects in
Highlights
-
Robust Economics: Base case after-tax NPV5% of
C with an after-tax IRR of$1,025 million 18.2% using a gold price assumption ofUS /ounce (鈥渙z鈥�). Using a spot gold price of$2,450 US /oz gold, after-tax NPV5% increases to$3,300 C and the after-tax IRR to$2,315 million 32.0% . -
Significant Production and Low Cost: 203,265 oz average annual gold production in the first 5 years at an all-in sustaining cost net of by-product credits (鈥淎ISC鈥�) of
US /oz and 122,041 oz average annual gold production over a 24.5-year LOM at an AISC of$1,024 US /oz.$1,338 -
Rapid Payback of Capital Expenditures:
C initial capital paid back over 3.4 years at PEA base case and decreasing to 2.0 years at spot gold price of$1,250 million $3,300 -
High Degree of Resource Confidence: Economic analysis is based on Measured and Indicated Resources sub-totalling
33.3% and65.1% respectively or grand total of98.4% but excludes potential upside opportunities from the 2025 drill results and MRE from thePhoenix deposit. - Low Risk: Conventional open pit and milling operation with road access and hydro-electric power.
-
New Innovative, De-risked Tailings Facility: Dry stack plus coarse free draining tailings, waste and water management facilities that are integrated and significantly reduce volume of tailings impacted runoff for treatment and discharge. The proposed tailings facility includes
100% reuse of process water, avoids discharge near the Cedar Point Provincial Park and minimizes the disturbance of fish bearing waters. The proposed tailings facility utilizes feedback obtained from the First Nations, nearby communities and industry to utilize best in class available environmental solutions that the Company anticipates will significantly reduce risks at closure and promote protection of the land and waterways to perpetuity. -
Significant Opportunities: Potential to further enhance Project economics and expand production rate have been identified with the addition of the maiden
Phoenix deposit MRE, ongoing endowment potential extensions and preconcentration technologies such as mineralized material sorting to boost mill feed grade. - Strong Discovery Growth Potential: Exploration diamond drill programs completed in 2024 and 2025 extended gold mineralization and intercepted higher-grade mineralization adjacent to Project infrastructure over a strike length in excess of 3 km.
Table 1: PEA Results Summary
Open Pit PEA Study Results |
2025 PEA Base Case |
Spot Prices (as of July 1, 2025)1 |
After-Tax NPV (C$M, |
|
|
After-Tax IRR (%) |
|
|
Annual Average Free Cash Flow (C$M)4 |
|
|
Annual Average Free Cash Flow Yr. 1-5 (C$M)4 |
|
|
Initial Capex (C$M) |
|
|
Total Cash Cost (US$ / Au oz)2 |
|
|
AISC (US$ / Au oz)3 |
|
|
Payback Period (years) After-Tax |
3.4 |
2.0 |
Nominal Processing Throughput (tpd) |
26,000 |
26,000 |
Strip Ratio (waste:mill feed resource) |
2:1 |
2:1 |
Mine Life (years) |
24.5 |
24.5 |
Annual Average Throughput (Mtpa) |
9,340 |
9,340 |
Annual Average Production (koz/a) |
122 |
122 |
Average Gold Head Grade (g/t) |
0.46 |
0.46 |
Average Gold Recovery (%) |
|
|
Metal Prices (US$ / oz) |
|
|
Exchange Rate USD/CAD |
1.35 |
1.35 |
Total LOM Au ounces produced (Moz) |
3.0 |
3.0 |
Total LOM Ag ounces produced (Moz) |
2.1 |
2.1 |
Notes for Table 1 |
||
1. Spot price is based on the LBMA gold price as of the close of business on July 1, 2025, rounded down to the nearest 2. Cash Costs consist of mining costs, processing costs, mine-level G&A, offsite charges, and royalties less by-product credits. Refer to the 鈥淣on-Gaap Financial Measures鈥� section in Appendix B of this news release for more information. 3. All-In Sustaining Costs (AISC) includes cash costs plus sustaining capital, closure costs, and salvage credits. Refer to the 鈥淣on-GAAP Financial Measures鈥� section in Appendix B of this news release for more information. 4. Free cash flow is calculated as after tax cash flow from mine-site operating activities less capital expenditures, including closure costs (net of salvage value). Refer to the 鈥淣on-GAAP Financial Measures鈥� section in Appendix B of this news release for more information. |
||
The economic analysis contained in this news release is preliminary in nature and is based primarily on Measured and Indicated Mineral Resources totalling
Table 2: ROM mill feed and ounces by resource category
Category |
ROM Mill Feed (Mt) |
ROM Au (Moz.) |
ROM Ag (Moz.) |
Measured |
76.2 |
1.22 |
1.62 |
Indicated |
148.9 |
2.10 |
3.09 |
Total M+I |
225.1 |
3.32 |
4.72 |
Inferred |
3.7 |
0.03 |
0.05 |
Mineral Resource Estimate for the Main Deposit
Note: The Main Deposit is included in the financial modelling for the 2025 PEA.
The updated MRE for the Main deposit is based on the amalgamation of what have been historically described as the Main Zone, North Zone, Slipper Zone, and K Zone, effective January 10, 2025, and it is reported at a 0.15 g/t gold cut-off (see Table 3). There is no certainty that Mineral Resources will be converted into Mineral Reserves. Mineral Resources that are not Mineral Reserves do not have demonstrated economic viability. Mineral Resources include Inferred Mineral Resources which have had insufficient work to classify them as Indicated Mineral Resources. It is uncertain but reasonably expected that Inferred Mineral Resources could be uplifted to Indicated Mineral Resources with additional drilling.
Geological and resource domain modelling and estimation for the Project was completed using Leapfrog 2024.1. The lithological model was developed based on data from the extensive re-logging program of 170,000 m drill core that was completed in 2023 and 2024, in addition to geochemical classification of 56,550 previously sampled intervals. Mineralization domains are modelled by identifying zones with gold values greater than 0.3 g/t over a minimum width of 3 m. Two primary styles of mineralization were recognized. Early mineralization includes disseminated stratabound mineralization in argillite-bearing lithologies. Late mineralization includes gold associated with late-stage quartz veins. Three high-confidence faults were modelled, including the North Fault, South Fault, and Fault 1. The Main Block is bound by the North and South Faults, representing significant discontinuities in stratigraphy and mineralization. Within the Main Block, Fault 1 introduces a minor offset in the main block.
Reasonable prospects for eventual economic extraction were evaluated by performing a pit optimization using the Lerchs-Grossman algorithm with the following parameters: gold price of
Total Measured and Indicated Mineral Resources for the Main deposit includes 292.1 Mt at an average grade of 0.44 g/t gold and 0.66 g/t silver, for a total of 4.2 M contained ounces of gold and 6.2 M contained ounces of silver. Total Inferred Mineral Resources for the Main deposit includes 14.8 Mt at an average grade of 0.33 g/t gold and 0.95 g/t silver, for a total of 0.2 M ounces of gold and 0.5 M ounces of silver.
Table 3: Mineral Resource for the Main deposit
Category |
Cut-off Grade |
Tonnes (kt) |
Au Avg. Grade |
Au (koz) |
Ag Avg. Grade |
Ag (koz) |
Measured |
0.15 |
77,370 |
0.53 |
1,321 |
0.68 |
1,701 |
Indicated |
0.15 |
214,702 |
0.41 |
2,842 |
0.65 |
4,463 |
Measured & Indicated |
0.15 |
292,072 |
0.44 |
4,163 |
0.66 |
6,163 |
Inferred |
0.15 |
14,830 |
0.33 |
155 |
0.95 |
454 |
Notes for Table 3: |
||||||
5. The qualified person responsible for the Main deposit MRE, with an effective as of as of January 10, 2025, is Bahram Bahrami, P.Geo of Equity Exploration Consultants Ltd. 6. Mineral Resources are classified in accordance with CIM (2014) definition standards 7. Bulk density assigned on a block per block basis 8 . Mineral Resources are reported using a 0.15 g/t gold cut-off grade
9. Metal price assumptions include
10. Metallurgical recoveries assumptions are
11. 99.8 payability for gold and 12. Numbers may not add due to rounding 13. Mineral resources are not Mineral reserves and do not have demonstrated economic viability. 14. The qualified persons responsible for this section of the technical report are not aware of any environmental, permitting, legal, title, taxation, socio-economic, marketing, political, or other relevant factors that could materially affect the Mineral Resource estimate other than those disclosed in this news release and in the PEA Technical Report. |
||||||
Mineral Resource Estimate for the Phoenix Deposit
Note: The Phoenix Deposit is not included in the financial modelling for the 2025 PEA.
The inaugural MRE for the
Table 4: Mineral Resources for the
Resource
|
Cut-off Grade
|
Tonnes
|
Gold Grade
|
Contained Gold
|
Indicated |
0.2 |
52 |
0.35 |
0.57 |
Inferred |
0.2 |
25,426 |
0.44 |
357 |
Notes for Tables 4 and 5: |
1. The qualified person responsible for the 2. Mineral Resources are classified in accordance with CIM (2014) definition standards 3. Mineral Resources are reported using a 0.20 g/t gold cut-off grade
4. Metal price assumptions include
5. Metallurgical recoveries assumptions are 6. 99.8 payability for gold 7. Numbers may not add due to rounding 8. Mineral Resources are not Mineral Reserves and do not have demonstrated economic viability. 9. The qualified persons responsible for this section of the technical report are not aware of any environmental, permitting, legal, title, taxation, socio-economic, marketing, political, or other relevant factors that could materially affect the Mineral Resource estimate other than those disclosed in this news release and in the PEA Technical Report 10. Refer to Appendix C for the estimation methodology |
Geological and resource modelling for the
Gold mineralization was modelled based on downhole structural data measured from oriented drill core. This interpretation includes identifying two principal sets of mineralized structures: flat to gently east-dipping and steeper northeast-dipping orientations. These define three mineralized lenses鈥攖wo upper, gently dipping zones and a deeper, steeper-dipping zone.
Capping values for the
The block model was constructed using a parent block size of 5m x 5m x 5m, with sub-blocks refined down to 1.25 m to accurately honor geological boundaries and minimum mining widths. Grade estimation was conducted using a combination of Ordinary Kriging (OK) and inverse distance cubed (ID3) methods. OK was used for all mineralized domains where variograms could be reliably modelled; ID3 was applied to other domains where variogram stability could not be achieved. Locally varying anisotropy (LVA) was applied within mineralized domains to reflect observed structural controls.
Resource classification followed the CIM Definition Standards (2014) and was guided by geological confidence, data spacing, and estimation support. The current drilling density supports predominantly Inferred classification. These are supported by at least two drill holes within a spacing of 鈮�155 m. Indicated Mineral Resources are supported by drill hole spacing of 鈮�70 m with minimum of 3 drill holes used for estimation.
Reasonable prospects for eventual economic extraction were applied by performing a resource pit optimization and applying the following parameters: a gold price of
For
Table 5: Mineral Resource for the
Resource
|
Cut-off Grade
|
Tonnes
|
Gold Grade
|
Contained Gold
|
Indicated |
0.15 |
96 |
0.27 |
0.8 |
0.2 |
52 |
0.35 |
0.6 |
|
0.25 |
35 |
0.41 |
0.5 |
|
0.3 |
23 |
0.47 |
0.4 |
|
Inferred |
0.15 |
33,451 |
0.37 |
402 |
0.2 |
25,426 |
0.44 |
357 |
|
0.25 |
20,152 |
0.49 |
319 |
|
0.3 |
16,827 |
0.54 |
290 |
Notes: See Table 4
Spanish Mountain Project Consolidated Mineral Resources
Total combined Mineral Resources for the Spanish Mountain Gold Project are summarized in Table 6. Total Measured and Indicated mineral resources include 292.1 Mt at 0.44 g/t gold for total 4.16 M contained gold ounces. Total inferred mineral resources include 40.3 Mt at 0.40 g/t gold for total 512 k contained gold ounces.
Table 6: Consolidated Mineral Resources for the Spanish Mountain Gold Project
Area |
Classification |
Cut Off Gold Grade
|
Tonnes (Mt) |
Gold (g/t) |
Contained Gold (koz) |
Silver (g/t) |
Contained Silver (koz) |
Main Deposit |
Measured |
0.15 |
77.4 |
0.53 |
1,321 |
0.68 |
1,701 |
Indicated |
214.7 |
0.41 |
2,842 |
0.65 |
4,463 |
||
M&I |
292.1 |
0.44 |
4,163 |
0.66 |
6,163 |
||
Inferred |
14.8 |
0.33 |
155 |
0.95 |
454 |
||
Phoenix Deposit |
Indicated |
0.20 |
0.1 |
0.35 |
0.58 |
- |
- |
Inferred |
25.4 |
0.44 |
357 |
- |
- |
||
Total Spanish Mountain Gold Project |
M&I |
听 |
292.1 |
0.44 |
4,164 |
0.66 |
6,163 |
Inferred |
40.3 |
0.40 |
512 |
0.95 |
454 |
Notes on Table 6: |
1. The Mineral Resource for the Main Deposit is reported using a cut-off grade of 0.15 g/t Au, while the Phoenix Deposit uses a 0.20 g/t Au cut-off.
2. The Mineral Resources are constrained within an optimized pit shell generated using Lerchs鈥揋rossman pit optimization based on a gold price of 3. Mineral Resources are derived from resource statements for each deposit and area, prepared by Bahram Bahrami, P.Geo., a Qualified Person as defined under NI 43-101. 4. Mineral Resources are not Mineral Reserves and do not have demonstrated economic viability. 5. The Mineral Resource estimate complies with NI 43-101 Standards of Disclosure for Mineral Projects (May 2016) and CIM Definition Standards for Mineral Resources and Mineral Reserves (May 2014). 6. Any discrepancies in totals are due to rounding. 7. The effective date of the Mineral Resource statement is January 10, 2025 for the Main Deposit and June 17, 2025 for the Phoenix Deposit. |
Mining and Processing
Open pit mine designs, mine production schedules and mine capital and operating costs have been developed for the Main deposit, at a scoping level of engineering. The mineral resources, including inferred resources, form the basis of the mine planning. The
Open pit mining activities are designed for approximately 24.5 years of operation. Mine planning is based on large scale conventional drill/blast/load/haul open pit mining methods suited for the Project location and local site requirements. The subset of mineral resources contained within the designed open pits are summarized in Table 7, with a 0.2 g/t Au cut-off grade, and form the basis of the mine plan and production schedule, which is summarized in Figure 5.
Table 7: PEA Mine Plan Production Summary
Mine Plan Pit Contents |
Total |
PEA Mill Feed |
229 Mt |
Mill Feed Au Grade |
0.46 g/t |
Mill Feed Au Metal |
3.3 Moz. |
Mill Feed Ag Grade |
0.65 g/t |
Mill Feed Ag Metal |
4.8 Moz. |
Waste Overburden and Rock |
458 Mt |
Waste: Resource Ratio |
2.0 |
Mill feed quantities and grades include estimates of mining dilution and recovery based on a 10 m selective block size and 2 m dilution skins applied to all waste contacts. This results in an addition of
Figure 5: PEA Mine Production Schedule Summary
Processing of the mill feed at 26,000 tpd (or 9.5 Mt per annum) is by means of a conventional process flowsheet including primary grinding, gravity concentration, flotation, and regrinding of the concentrate followed by cyanidation via a CIL circuit to produce dor茅. The process achieves an average overall LOM gold recovery of
The tailings storage facilities proposed for construction and development at Project are primarily based on utilization of filtered tailings technology for the base case scenario. Multiple tailings storage locations, designs, and technologies were analyzed to arrive at the preferred location and tailings technology.
Initial Capital Costs
The initial capital expenditures for the Project as estimated by Ausenco are summarized in Table 8 and the capital expenditures to be incurred after the start-up of operations are assigned to sustaining capital and are projected to be covered by operating cash-flows. Project contingencies have been added where applicable, excluding capitalized operating costs, which results in an overall contingency of
The Project will benefit from established infrastructure in central
Table 8: Initial Capital Cost Estimate
2025 PEA Total (C$M) |
|
Mining (Including contingency) |
|
Process Plant and Facilities(1) |
|
On-site Infrastructure (including tailings, water management, water treatment, environmental, site costs, and earthworks)(1) |
|
Off-site Infrastructure |
|
Project Indirects |
|
EPCM, Owners Cost, Consultants |
|
Project Contingency (excluding mining contingency) |
|
TOTAL(2) |
|
Notes on Table 8: |
1. Direct process plant capital costs are based on benchmarking and not from engineering design. 2. Totals do not necessarily equal the sum of the components due to rounding adjustments; not all cost components are illustrated in this table. |
Sustaining Capital Costs:
Ausenco estimates the LOM sustaining capital for Project to be
On Site Direct Operating Costs (鈥淥pex鈥�)
The estimated Opex for Project is
Table 9: On Site Operating Cost for Base Case
Metric |
Unit |
2025 PEA |
Open pit mining cost (excl. pre-prod) |
US$/t milled |
7.60 |
Processing cost (excluding G&A) |
US$/t milled |
6.66 |
G&A |
US$/t milled |
1.07 |
Total site operating cost |
US$/t |
15.33 |
Notes for Table 9: |
1. Totals do not necessarily equal the sum of the components due to rounding adjustments; not all cost components are illustrated in this table. |
Royalties
There is a 1.0 to
Infrastructure
The major infrastructure items considered and costed in the PEA support a mining and milling operation that is expected to operate 24-hours per day, seven-days per week. The design of Project infrastructure has prioritized environmental protection, workforce safety, and operating efficiency while minimizing community impacts. The Project site will consist of the open pit mine and mining related workshops, a processing plant, waste rock and tailings stack, and support service infrastructure such as warehousing, offices and workshops.
The Project site-wide water balance is positive for which water capture, treatment and discharge infrastructure has been allowed for and designed. The Project will draw water from within the property and contain process water and tailings within the water management pond and tailings stack, effectively. Water management and treatment has been included to treat both open pit dewatering and surface facilities run-off to required environmental discharge standards.
The site will be supported by renewable electrical grid power through a new, 75 km long 230kV, transmission line constructed by the Company from site to a new switching station designated as SMM, which is currently being designed by BC Hydro, located near the McLeese Lake Capacitor station. The mine and process operations are supported by functional maintenance and administration infrastructure located on site as well as off-site locations for non-critical administrative functions. Select local access roads will be upgraded and maintained throughout the mine life.
The proposed tailings storage method is placement of dewatered material containing both tailings and minor amounts of process water. The minor proportion of Potential Acid Generating (鈥淧AG鈥�) tailings will be managed within a dedicated conventional tailings lined cell contained within the tailings stack. NAG waste rock, PAG waste rock and over burden will be split by type and placed in suitably designed facilities that will be designed for physical stability and collect and manage run-off from the waste rock storage facilities. All facilities are located near the open pit mine to maximize efficiencies and minimize impact, subject to condemnation drilling.
Environmental and Community Matters
All exploration permits with the Government of
Opportunities and Future Work
Ausenco, the team of consultants, and the Company have identified several areas and opportunities that may provide significant costs savings and improved economics for the Project. Post-PEA the Company will embark on additional technical work and engineering studies to better position and further de-risk the Project, including but not limited to the following:
Mining
- Optimization of the pit phasing and mine production schedule, especially as the Mineral Resource is modified through further exploration and infill drilling;
- Optimization of the open-pit design through collection of additional geotechnical information;
- Further work to increase confidence in the Mineral Resource and lead to the definition of a Mineral Reserve;
- Detailed equipment costing to determine potential discounts to list price for all major components, as well as review purchase versus leasing options for mining equipment;
- Further planned electrification of the mine fleet, specifically the mine hauling function, as cutting-edge technologies for battery and trolley operations become commercialized in the near future; and
- Back-filling of waste rock into the open pit.
Milling and Metallurgy
- Additional metallurgical work to optimize results from geometallurgical domains and continue research on the optimum grind size, analyze recoveries of the gold and silver, and the effects of the higher grade coming from the mineral sorters on metal recoveries;
- Optimize reagents to reduce costs and improve metallurgy;
- Investigate the potential for a gold recovery circuit from a pyrite concentrate not currently in the PEA; and
- Ore sorting of low grade for expansion scenarios.
Tailings Storage and Waste Rock Facilities
- Detailed analysis of tailings storage and waste rock storage facilities for an integrated waste management plan and design to optimize the management of mine-impacted runoff and associated collection and treatment costs;
- Phasing of tailings and water storage starter structures to reduce initial capex;
- Alternative water treatment solutions being considered to the included reverse osmosis that meet BC discharge regulations; and
- Whole tailings belt filtration options to dewater tails before placement.
Other
- Construction camp location, and a trade-off study between at site accommodation versus daily commutes to the Project from local communities;
- Investigate regional quarry sites and quality of quarry material for construction purposes, notably the tailing storage facility;
- Water supply for the Project, and a trade-off study between a constructed reservoir with Project infrastructure or a water pipeline from a local source; and
-
Addition of the 2025 drill results and
Phoenix maiden resource.
Changes to the conceptual mine plan and mine design that may be recommended in the PEA study, if approved and implemented as the Project moves forward, could impact the capital and operating costs, profitability and cash flows and an eventual timeline to production, the impact of which cannot be quantified at this time. As a result, there are additional uncertainties with respect to the size and grade of the Mineral Resources that may become Mineral Reserves in the future, and that will serve as the basis for future studies.
In addition, the Company will continue to conduct exploration activities within the 11,633-hectare (鈥渉a鈥�) SMG mineral claims property which encompasses the estimated MRE, which the PEA is based upon. The objective of continuing regional exploration is to develop and assess targets that could further maximize the Company鈥檚 flexibility with respect to future development decisions on the Project.
Additional Considerations Related to the PEA
Investors should be cautioned that there is no guarantee that the future construction and development of the Project that will be completed in accordance with the 2025 PEA results set forward in this news release. There is no certainty that production will begin, or that operating capital, or that financial results will be consistent with the 2025 PEA.
Technical Information and Quality Control & Quality Assurance (鈥淨AQC鈥�)
Once received from the drill and processed, all drill core samples were sawn in half, labeled, and bagged. The remaining half of the drill core was securely stored on-site. Numbered security tags were applied to sample shipments to ensure chain of custody compliance. The Company inserts quality control (QC) samples at regular intervals, including blanks and reference materials, for all sample shipments to monitor laboratory performance. Standards and blanks account for a minimum of
Drill core samples from the 2025 drill program were submitted to MSALABS鈥� analytical facility in
PhotonAssayTM
The PhotonAssayTM method utilizes gamma ray analysis for gold detection using the Chrysos PhotonAssayTM instrument (PA1408X). This non-destructive, fully automated technique offers high accuracy for analyzing crushed core and pulps. Sample preparation begins with drying and crushing up to 1 kg of material to achieve at least
The PhotonAssayTM instrument bombards 400 to 600-gram samples contained in sealed containers with gamma rays. These containers remain sealed throughout the process, preserving the sample for potential further testing. The analysis is performed robotically, with results that integrate into existing laboratory management systems.
Each sample is accompanied by a reference disc traceable to a Certified Reference Material (CRM). Both the sample and reference disc undergo gamma ray exposure, with signals detected and analyzed to ensure accurate and reliable results.
The method offers a gold detection range from 0.015 parts per million (ppm - lower limit) to 10,000 ppm (upper limit). Quality control includes the use of reference materials and blanks, with all results reviewed by a competent person before reporting.
Spanish Mountain Gold implemented two QAQC methodologies to validate the accuracy of PhotonAssayTM results, both demonstrating good comparability: 1) comparative analysis of diverse mineralization styles using Total Au screen metallic methods with both FAS-415 (gravimetric finish) and FAS-211 (AAS finish), and 2) comprehensive testing of both sample aliquots and rejects using FAS-211 (AAS finish).
QAQC Testing typically can include the following spot checks: 1) Pulverizing tests to evaluate variability in sample preparation, 2) Cross-analysis at external laboratories using screen metallic method, and 3) Four-cycle radiation testing to identify and calibrate potential variability in gold results with variable radiation intensity.
To effectively manage the nugget effect on high-grade gold samples MSALABS tested samples to "extinction" (CPA-Au1E method). This approach divides samples into multiple splits, analyzes each separately using PhotonAssayTM, and then calculates a weighted average of the results. By testing various portions of the sample independently and combining their values proportionally, this method provides significantly more representative gold values than traditional single-split analysis for samples with a large nugget effect.
Multi-Elemental Analysis
For the 2025 drilling campaign Spanish Mountain Gold used IMS-230 method to provide multi-element determination using a four-acid digestion followed by ICP-OES and ICP-MS analysis.
Key Process Steps:
Sample Preparation: Samples are dried and ground to specific criteria (
Digestion: Samples undergo sequential digestion with nitric, perchloric, hydrofluoric, and hydrochloric acids, followed by dilution with deionized water. Analysis: The solution is analyzed via ICP-OES and ICP-MS for multi-element quantification. Quality Control: The process includes reference materials, blanks, and duplicates, with corrections for spectral interferences and thorough review before final reporting.
Qualified Persons
Various consultants provided input and helped write the forthcoming PEA Technical Report. Consultants that are responsible for elements of the Technical Report are independent qualified persons (鈥淨P鈥�) as defined within NI 43-101.
- Geology: Ron Voordouw, P.Geo., Equity Exploration
- Mineral Resource for Main Deposit: Bahram Bahrami, P.Geo., Equity Exploration
- Mineral Resource for Phoenix Deposit: Bahram Bahrami, P.Geo., Equity Exploration
- Metallurgy, Processing, Infrastructure, and Economic Evaluation: Kevin Murray, P.Eng., Ausenco
- Mining: Marc Schulte, P.Eng., Moose Mountain Technical Services
- Tailings and Water Management: Brad Russell, P.Eng., BGC
- Water Treatment: Lee Josslyn, PE, Linkan Engineering
- Geochemistry: Andrea Samuels, P.Geo., pHase Geochemistry
- Off-site Power and Electrical: Neil Brazier, P.Eng., WN Brazier Associates
- Environmental & Community: James Millard, P.Geo., Ausenco
The QPs have reviewed the information in this news release that pertain to the sections of the forthcoming PEA Technical Report for which they are responsible. All scientific and technical information in this press release in respect of the PEA is based on information prepared by or under the supervision of those individuals. The Mineral Resource estimate in this news release has been classified in accordance with CIM Definition Standards 鈥� For Mineral Resources and Mineral Reserves (May 14, 2014) and CIM Estimation of Mineral Resources & Mineral Reserves Best Practice Guidelines (November 29, 2019).
In accordance with NI 43-101, the PEA Technical Report will be filed on SEDAR within 45 days of the disclosure of this news release.
Julian Manco, M.Sc., P.Geo., Director of Exploration with Spanish Mountain Gold, is the Qualified Person as defined under National Instrument 43-101 who has reviewed and has approved the contents of this news release.
About the Company
Spanish Mountain Gold Ltd. is focused on advancing its
Cautionary Statement on Mineral Resource Estimates
All Mineral Resource estimates of the Company disclosed or referenced in this news release have been prepared in accordance with the Canadian Institute of Mining, Metallurgy and Petroleum ("CIM") Definition Standards on Mineral Resources and Mineral Reserves dated May 10, 2014 ("2014 CIM Definition Standards"), whose definitions are incorporated by reference in National Instrument 43-101 - Standards of Disclosure for Mineral Projects ("NI 43-101"):
Mineral resource: is a concentration or occurrence of material of economic interest in or on the earth's crust in such form, grade or quality, and quantity that there are reasonable prospects for economic extraction. A mineral resource is a reasonable estimate of mineralization, taking into account relevant factors such as cut-off grade, likely mining dimensions, location or continuity, that, with the assumed and justifiable technical and economic conditions, is likely to, in whole or in part, become economically extractable.
Inferred mineral resource: is that part of a mineral resource for which quantity and grade or quality can be estimated on the basis of geological evidence and limited sampling and reasonably assumed, but not verified, geological and grade continuity. The estimate is based on limited information and sampling gathered through appropriate techniques from locations such as outcrops, trenches, pits, workings and drill holes. An inferred mineral resource has a lower level of confidence than that applying to an indicated mineral resource and must not be converted to a mineral reserve. It is reasonably expected that the majority of inferred mineral resources could be upgraded to indicated mineral resources with continued exploration.
Indicated mineral resource: that part of a mineral resource for which quantity, grade or quality, densities, shape and physical characteristics can be estimated with a level of confidence sufficient to allow the appropriate application of technical and economic parameters to support mine planning and evaluation of the economic viability of the deposit. The estimate is based on detailed and reliable exploration and testing information gathered through appropriate techniques from locations such as outcrops, trenches, pits, workings and drill holes that are spaced closely enough for geological and grade continuity to be reasonably assumed. An indicated mineral resource has a lower level of confidence than that applying to a measured mineral resource and may only be converted to a probable mineral reserve.
Measured mineral resource: that part of a mineral resource for which quantity, grade or quality, densities, shape and physical characteristics are so well established that they can be estimated with confidence sufficient to allow the appropriate application of technical and economic parameters to support production planning and evaluation of the economic viability of the deposit. The estimate is based on detailed and reliable exploration, sampling and testing information gathered through appropriate techniques from locations such as outcrops, trenches, pits, workings and drill holes that are spaced closely enough to confirm both geological and grade continuity. A measured mineral resource has a higher level of confidence than that applying to either an indicated mineral resource or an inferred mineral resource. It may be converted to a proven mineral reserve or to a probable mineral reserve.
Neither the TSX Venture Exchange nor its Regulation Services Provider (as that term is defined in the policies of the TSX Venture Exchange) accepts responsibility for the adequacy or accuracy of this release.
FORWARD-LOOKING INFORMATION:
Certain of the statements and information in this press release constitute "forward-looking information". Any statements or information that express or involve discussions with respect to predictions, expectations, beliefs, plans, projections, objectives, assumptions or future events or performance (often, but not always, using words or phrases such as "expects", "anticipates", "believes", "plans", "estimates", "intends", "targets", "goals", "forecasts", "objectives", "potential" or variations thereof or stating that certain actions, events or results "may", "could", "would", "might" or "will" be taken, occur or be achieved, or the negative of any of these terms and similar expressions) are not statements of historical fact and may be considered forward-looking information. The Company's forward-looking information is based on the assumptions, beliefs, expectations and opinions of management as of the date of this press release and include but are not limited to information with respect to, the potential to extend mineralization within the near-surface environment; the potential to expand resources and to find higher-grade mineralization at depth; the timing, size and budget of a winter drill program, and the results thereof; and the delivery of a maiden resource for the Phoenix Deposit within the Phoenix Target, and the timing and results thereof. Other than as required by applicable securities laws, the Company does not assume any obligation to update forward-looking information if circumstances or management's assumptions, beliefs, expectations or opinions should change, or changes in any other events affecting such statements or information. For the reasons set forth above, investors should not place undue reliance on forward-looking information.
APPENDIX A
Key PEA Improvements and Optimizations vs. 2021 PFS
The 2025 PEA incorporates several important improvements and de-risking initiatives compared to the 2021 Prefeasibility Study, all of which better positions the Project for a successful next phase of development. Notable changes include:
-
Larger Project Scale: The project has increased the production rate from 20 ktpd to 26 ktpd, which increases the LOM average gold production profile by
19% to 122 koz per year, and 203 koz per year in the first five years. For the project, this will bring greater efficiency, lower unit costs, and uplift to the NPV, in addition to expanding Life of Mine (LOM) to 24.5 years and total gold production to 3.0Moz. Pre-concentration of mill feed to uplift feed grade to the proposed 26 ktpd mill such as mineralized material sorting was investigated during the PEA. It was identified as a target case opportunity to 鈥榖olt-on鈥� to the base case which will be further assessed during the next stages of project development.
-
Improved Flowsheet Design: Updated metallurgical studies and testing has resulted in modification to a coarse mill feed floatation circuit with cleaner and scavenger stages and two gravity circuits, lowering power costs while boosting throughput These circuit modifications, when combined with a rougher and cleaner flotation circuit, resulted in overall project gold recovery of
89.3% with approximately20% of gold expected to be recovered by gravity.
- Optimized Open Pit Mine Design: Through targeting lower strip ratios based upon improved geotechnical assessments, additional resource included in the mine plan and better stockpile management, an optimum open pit was selected to maximize efficiency. A selective mining unit (SMU) analysis was completed on bench mining dimensions, block model block sizes and equipment sizing, selection concluding that larger 240 t class trucks and associated fleet are optimal for the project. This also means higher productivities and less cost moving material to either the process plant or waste rock pads are possible. The LOM waste to resource strip ratio reduces to 2:1 in the PEA from 4:1 in the PFS.
- Electrification: The future electrification of the mine and equipment is expected to increase productivity with a significantly lower carbon intensity. The upsized power from 30 MW in the PFS to 60 MW included in the PEA is expected to potentially support the future electrification of the mine fleet and equipment. Equipment proposed in the PEA includes renewable diesel capable haul trucks and electrification of drills and shovels.
-
New Tailings Stack: With coarser sized tailings material from coarse mill feed floatation, screening and filtered tailings, dewatering and placement of landforms has been selected. This is expected to result in improved geotechnical stability and enabling a safer site. This Tailings Stack location avoids the large
Cedar Creek water catchment. As well, moving from a conventional slurry containment to a free draining, filtered tails means this coarser product minimizes borrow pit and starter dyke construction costs, meaning more placement flexibility and reduced starter material costs while lowering the potential for mineral endowment sterilization.
-
Mineral Resource Estimate: Constrained geological interpretation and estimation methodology resulted in a decrease of the Main deposit Indicated and Inferred contained gold ounces. The decrease of Inferred total contained gold ounces of the Main deposit are partially offset by an increase of Inferred contained gold ounces of the
Phoenix deposit. The Main deposit andPhoenix deposit show potential for resource expansion and classification uplift.
APPENDIX B
Proposed site layout
General End Notes (excluding tables)
-
In this news release the Company uses certain abbreviations, including: net present value ("NPV"); NPV at a
5% discount rate ("NPV5%"); internal rate of return ("IRR"); measured and indicated ("M&I"); million ("m"); thousand ("k"); metric tonne ("t"); troy ounce ("oz"); grams per tonne ("g/t"); gold ("Au"); silver ("Ag"); life of mine ("LOM"); tonnes per day ("tpd"); free cash flow ("FCF"); years ("yrs"); per annum ("pa"); average ("avg."); life-of-mine ("LOM"); versus ("vs."); non acid generating (鈥淣AG鈥�); potentially acid generating (鈥淧AG鈥�). -
Payback is calculated from commercial production, which is defined as the achievement of reaching a minimum of 30 consecutive days of operations during which the mill operated at an average of
60% of nameplate throughput of 26,000 tpd. -
Spot price is based on the LBMA gold price as of the close of business on July 1, 2025, rounded down to the nearest
$100 $1
USE OF NON-GAAP MEASURES
- Certain financial measures referred to in this news release are not measures recognized under IFRS and are referred to as non-GAAP financial measures or ratios. These measures have no standardized meaning under IFRS and may not be comparable to similar measures presented by other companies. The definitions established and calculations performed by Ausenco are based on the QP鈥檚 reasonable judgement and are consistently applied. These measures are intended to provide additional information and should not be considered in isolation or as a substitute for measures prepared in accordance with IFRS.
- The non-GAAP financial measures used in this news release and common to the gold mining industry are cash costs and all-in sustaining cost per ounce of gold produced and free cash flow.
- Free cash flow, Cash costs, and All-in sustaining cost per ounce of gold sold are non-GAAP financial measures or ratios and have no standardized meaning under IFRS Accounting Standards (鈥淚FRS鈥�) and may not be comparable to similar measures used by other issuers. As the Company is not in production, the Company does not have historical non-GAAP financial measures nor historical comparable measures under IFRS, and therefore the foregoing prospective non-GAAP financial measures or ratios may not be reconciled to the nearest comparable measures under IFRS.
- Cash Costs consist of mining costs, processing costs, mine-level G&A, offsite charges, and royalties less by-product credits.
- All-In Sustaining Costs (AISC) includes cash costs plus sustaining capital, closure costs, and salvage credits.
- Free cash flow is calculated as after-tax cash flow from mine-site operating activities less capital expenditures, including closure costs (net of salvage value).
APPENDIX C
The estimation methodology for the Main Deposit is similar to Phoenix Deposit except for: (1) outlier restrictions for the lithology domains use higher gold thresholds (3 g/t vs 0.2 g/t) with different search distance criteria (20
View source version on businesswire.com:
For more information, contact:
Peter Mah, President, CEO, and Director
+1 (604) 601-3651
[email protected]
Source: Spanish Mountain Gold Ltd.