TWO Reports Second Quarter 2025 Financial Results
Wider Spreads Lead to Attractive Levered Returns
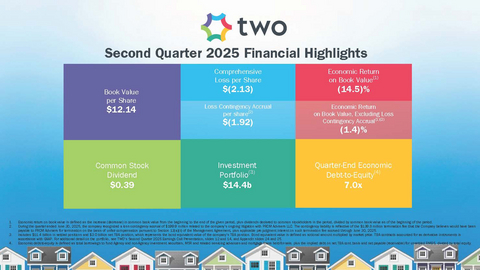
TWO Second Quarter 2025 Earnings Summary
Quarterly Summary
-
Reported book value of
$12.14 $0.39
-
Incurred a Comprehensive Loss of
$(221.8) million $(2.13)
-
Recorded a contingency liability and related expense of
$199.9 million $1.92
- Excluding the loss contingency accrual recognized during the quarter:
-
Generated a (1.4)% quarterly economic return on book value. For the first six months of 2025, generated a
2.9% total economic return on book value.(1)
-
Incurred a Comprehensive Loss of
$(21.9) million $(0.21)
-
Issued
$115.0 million 9.375% Senior Notes due 2030 through an underwritten offering for net proceeds of$110.8 million
-
Settled
$6.6 billion
-
As of June 30, 2025, MSR portfolio had a weighted average gross coupon rate of
3.53% and a 60+ day delinquency rate of0.82% , compared to0.85% as of March 31, 2025. For the second quarter of 2025, MSR portfolio experienced a 3-month CPR of5.8% , compared to5.3% for the second quarter of 2024.
-
Funded
$48.6 million $44.0 million
鈥淭he combination of our investment portfolio and operating company allows us to be dynamic and responsive as opportunities emerge across the mortgage finance space,鈥� said Bill Greenberg, TWO鈥檚 President and Chief Executive Officer. 鈥淕iven the strength of our platform and the depth of expertise across our team, we are confident in our ability to navigate through changing market cycles, creating long-term value for our stockholders, customers, and business partners.鈥�
________________ |
|
(1) |
Economic return on book value is defined as the increase (decrease) in common book value from the beginning to the end of the given period, plus dividends declared to common stockholders in the period, divided by common book value as of the beginning of the period. |
(2) |
The contingency liability is reflective of the |
鈥淔ixed-income and equity markets proved resilient in the second quarter,鈥� stated Nick Letica, TWO鈥檚 Chief Investment Officer. 鈥淲hile we will continue to be mindful of the many sources of volatility that can impact our portfolio, we believe there is also opportunity in this environment. Spreads for Agency RMBS remain historically wide, and offer good relative value to other high quality spread assets. Our core strategy of low coupon MSR paired with Agency RMBS is well positioned to benefit from both stable prepayments and wide Agency RMBS spreads.鈥�
Operating Performance
The following table summarizes the company鈥檚 GAAP and non-GAAP earnings measurements and key metrics for the second quarter of 2025 and first quarter of 2025:
Operating Performance (unaudited) |
|||||||||||||||||||||
(dollars in thousands, except per common share data) |
|||||||||||||||||||||
听 |
Three Months Ended June 30, 2025 |
听 |
Three Months Ended March 31, 2025 |
||||||||||||||||||
Earnings attributable to common stockholders |
Earnings |
听 |
Per weighted average basic common share |
听 |
Annualized return on average common equity |
听 |
Earnings |
听 |
Per weighted average basic common share |
听 |
Annualized return on average common equity |
||||||||||
Comprehensive (Loss) Income |
$ |
(221,807 |
) |
听 |
$ |
(2.13 |
) |
听 |
(64.3 |
)% |
听 |
$ |
64,931 |
听 |
听 |
$ |
0.62 |
听 |
听 |
16.8 |
% |
GAAP Net Loss |
$ |
(272,280 |
) |
听 |
$ |
(2.62 |
) |
听 |
(79.0 |
)% |
听 |
$ |
(92,241 |
) |
听 |
$ |
(0.89 |
) |
听 |
(23.8 |
)% |
Earnings Available for Distribution(1) |
$ |
29,545 |
听 |
听 |
$ |
0.28 |
听 |
听 |
8.6 |
% |
听 |
$ |
25,092 |
听 |
听 |
$ |
0.24 |
听 |
听 |
6.5 |
% |
听 |
听 |
听 |
听 |
听 |
听 |
听 |
听 |
听 |
听 |
听 |
听 |
||||||||||
Operating Metrics |
听 |
听 |
听 |
听 |
听 |
听 |
听 |
听 |
听 |
听 |
听 |
||||||||||
Dividend per common share |
$ |
0.39 |
听 |
听 |
听 |
听 |
听 |
听 |
$ |
0.45 |
听 |
听 |
听 |
听 |
听 |
||||||
Annualized dividend yield(2) |
听 |
14.5 |
% |
听 |
听 |
听 |
听 |
听 |
听 |
13.5 |
% |
听 |
听 |
听 |
听 |
||||||
Book value per common share at period end |
$ |
12.14 |
听 |
听 |
听 |
听 |
听 |
听 |
$ |
14.66 |
听 |
听 |
听 |
听 |
听 |
||||||
Economic return on book value(3) |
听 |
(14.5 |
)% |
听 |
听 |
听 |
听 |
听 |
听 |
4.4 |
% |
听 |
听 |
听 |
听 |
||||||
Operating expenses, excluding non-cash LTIP amortization and certain operating expenses(4) |
$ |
38,090 |
听 |
听 |
听 |
听 |
听 |
听 |
$ |
40,465 |
听 |
听 |
听 |
听 |
听 |
||||||
Operating expenses, excluding non-cash LTIP amortization and certain operating expenses, as a percentage of average equity(4) |
听 |
7.6 |
% |
听 |
听 |
听 |
听 |
听 |
听 |
7.5 |
% |
听 |
听 |
听 |
听 |
||||||
_______________ |
|
(1) |
Earnings Available for Distribution, or EAD, is a non-GAAP measure. Please see page 11 for a definition of EAD and a reconciliation of GAAP to non-GAAP financial information. |
(2) |
Dividend yield is calculated based on annualizing the dividends declared in the given period, divided by the closing share price as of the end of the period. |
(3) |
Economic return on book value is defined as the increase (decrease) in common book value from the beginning to the end of the given period, plus dividends declared to common stockholders in the period, divided by the common book value as of the beginning of the period. |
(4) |
Excludes non-cash equity compensation expense of |
Portfolio Summary
As of June 30, 2025, the company鈥檚 portfolio was comprised of
The following tables summarize the company鈥檚 investment portfolio as of June 30, 2025 and March 31, 2025:
Investment Portfolio |
||||||||||||||
(dollars in thousands) |
||||||||||||||
听 |
||||||||||||||
Portfolio Composition |
听 |
As of June 30, 2025 |
听 |
As of March 31, 2025 |
||||||||||
听 |
听 |
(unaudited) |
听 |
(unaudited) |
||||||||||
Agency RMBS |
听 |
$ |
8,387,068 |
听 |
73.5 |
% |
听 |
$ |
8,627,708 |
听 |
74.4 |
% |
||
Mortgage servicing rights(1) |
听 |
听 |
3,015,643 |
听 |
听 |
26.5 |
% |
听 |
听 |
2,959,773 |
听 |
听 |
25.6 |
% |
Other |
听 |
听 |
3,449 |
听 |
听 |
鈥� |
% |
听 |
听 |
3,613 |
听 |
听 |
鈥� |
% |
Aggregate Portfolio |
听 |
听 |
11,406,160 |
听 |
听 |
听 |
听 |
听 |
11,591,094 |
听 |
听 |
听 |
||
Net TBA position(2) |
听 |
听 |
3,025,099 |
听 |
听 |
听 |
听 |
听 |
3,001,064 |
听 |
听 |
听 |
||
Total Portfolio |
听 |
$ |
14,431,259 |
听 |
听 |
听 |
听 |
$ |
14,592,158 |
听 |
听 |
听 |
||
________________ |
|
(1) |
Based on the prior month-end鈥檚 principal balance of the loans underlying the company鈥檚 MSR, increased for current month purchases. |
(2) |
Represents bond equivalent value of TBA position. Bond equivalent value is defined as notional amount multiplied by market price. Accounted for as derivative instruments in accordance with GAAP. |
Portfolio Metrics Specific to Agency RMBS |
听 |
As of June 30, 2025 |
听 |
As of March 31, 2025 |
||||
听 |
听 |
(unaudited) |
听 |
(unaudited) |
||||
Weighted average cost basis(1) |
听 |
$ |
101.24 |
听 |
听 |
$ |
101.50 |
听 |
Weighted average experienced three-month CPR |
听 |
听 |
8.4 |
% |
听 |
听 |
7.0 |
% |
Gross weighted average coupon rate |
听 |
听 |
6.1 |
% |
听 |
听 |
6.1 |
% |
Weighted average loan age (months) |
听 |
听 |
27 |
听 |
听 |
听 |
28 |
听 |
______________ |
|
(1) |
Weighted average cost basis includes Agency principal and interest RMBS only and utilizes carrying value for weighting purposes. |
Portfolio Metrics Specific to MSR(1) |
听 |
As of June 30, 2025 |
听 |
As of March 31, 2025 |
||||
(dollars in thousands) |
听 |
(unaudited) |
听 |
(unaudited) |
||||
Unpaid principal balance |
听 |
$ |
198,822,611 |
听 |
听 |
$ |
196,773,345 |
听 |
Gross coupon rate |
听 |
听 |
3.5 |
% |
听 |
听 |
3.5 |
% |
Current loan size |
听 |
$ |
330 |
听 |
听 |
$ |
330 |
听 |
Original FICO(2) |
听 |
听 |
760 |
听 |
听 |
听 |
760 |
听 |
Original LTV |
听 |
听 |
73 |
% |
听 |
听 |
72 |
% |
60+ day delinquencies |
听 |
听 |
0.8 |
% |
听 |
听 |
0.8 |
% |
Net servicing fee |
听 |
25.4 basis points |
听 |
25.3 basis points |
||||
听 |
听 |
听 |
听 |
听 |
||||
听 |
听 |
Three Months Ended
|
听 |
Three Months Ended
|
||||
听 |
听 |
(unaudited) |
听 |
(unaudited) |
||||
Fair value losses |
听 |
$ |
(35,902 |
) |
听 |
$ |
(36,221 |
) |
Servicing income |
听 |
$ |
147,961 |
听 |
听 |
$ |
146,870 |
听 |
Servicing costs |
听 |
$ |
2,322 |
听 |
听 |
$ |
3,302 |
听 |
Change in servicing reserves |
听 |
$ |
64 |
听 |
听 |
$ |
(105 |
) |
________________ |
|
(1) |
Metrics exclude residential mortgage loans in securitization trusts for which the company is the named servicing administrator. Portfolio metrics, other than UPB, represent averages weighted by UPB. |
(2) |
FICO represents a mortgage industry accepted credit score of a borrower. |
Other Investments and Risk Management Metrics |
听 |
As of June 30, 2025 |
听 |
As of March 31, 2025 |
||||
(dollars in thousands) |
听 |
(unaudited) |
听 |
(unaudited) |
||||
Net long TBA notional(1) |
听 |
$ |
3,040,382 |
听 |
听 |
$ |
3,070,552 |
听 |
Futures notional |
听 |
$ |
(3,398,092 |
) |
听 |
$ |
(2,930,590 |
) |
Interest rate swaps notional |
听 |
$ |
19,526,559 |
听 |
听 |
$ |
14,755,568 |
听 |
________________ |
|
(1) |
Accounted for as derivative instruments in accordance with GAAP. |
Financing Summary
The following tables summarize the company鈥檚 financing metrics and outstanding repurchase agreements, revolving credit facilities, warehouse lines of credit, senior notes and convertible senior notes as of June 30, 2025 and March 31, 2025:
June 30, 2025 |
听 |
Balance |
听 |
Weighted Average Borrowing Rate |
听 |
Weighted Average Months to Maturity |
听 |
Number of Distinct Counterparties |
|||||
(dollars in thousands, unaudited) |
听 |
听 |
听 |
听 |
听 |
听 |
听 |
听 |
|||||
Repurchase agreements collateralized by securities |
听 |
$ |
7,992,622 |
听 |
4.48 |
% |
听 |
1.96 |
听 |
18 |
|||
Repurchase agreements collateralized by MSR |
听 |
听 |
790,000 |
听 |
听 |
7.39 |
% |
听 |
10.54 |
听 |
听 |
3 |
听 |
Total repurchase agreements |
听 |
听 |
8,782,622 |
听 |
听 |
4.74 |
% |
听 |
2.73 |
听 |
听 |
19 |
听 |
Revolving credit facilities collateralized by MSR and related servicing advance obligations |
听 |
听 |
1,011,871 |
听 |
听 |
7.36 |
% |
听 |
19.96 |
听 |
听 |
3 |
听 |
Warehouse lines of credit collateralized by mortgage loans |
听 |
听 |
9,275 |
听 |
听 |
6.31 |
% |
听 |
2.47 |
听 |
听 |
1 |
听 |
Unsecured senior notes |
听 |
听 |
110,867 |
听 |
听 |
9.38 |
% |
听 |
61.55 |
听 |
听 |
n/a |
听 |
Unsecured convertible senior notes |
听 |
听 |
260,944 |
听 |
听 |
6.25 |
% |
听 |
6.54 |
听 |
听 |
n/a |
听 |
Total borrowings |
听 |
$ |
10,175,579 |
听 |
听 |
听 |
听 |
听 |
听 |
听 |
|||
March 31, 2025 |
听 |
Balance |
听 |
Weighted Average Borrowing Rate |
听 |
Weighted Average Months to Maturity |
听 |
Number of Distinct Counterparties |
|||||
(dollars in thousands, unaudited) |
听 |
听 |
听 |
听 |
听 |
听 |
听 |
听 |
|||||
Repurchase agreements collateralized by securities |
听 |
$ |
8,970,830 |
听 |
4.50 |
% |
听 |
2.23 |
听 |
18 |
|||
Repurchase agreements collateralized by MSR |
听 |
听 |
770,000 |
听 |
听 |
7.38 |
% |
听 |
13.88 |
听 |
听 |
3 |
听 |
Total repurchase agreements |
听 |
听 |
9,740,830 |
听 |
听 |
4.73 |
% |
听 |
3.16 |
听 |
听 |
19 |
听 |
Revolving credit facilities collateralized by MSR and related servicing advance obligations |
听 |
听 |
933,171 |
听 |
听 |
7.45 |
% |
听 |
15.91 |
听 |
听 |
3 |
听 |
Warehouse lines of credit collateralized by mortgage loans |
听 |
听 |
7,971 |
听 |
听 |
6.36 |
% |
听 |
2.50 |
听 |
听 |
1 |
听 |
Unsecured senior notes |
听 |
听 |
鈥� |
听 |
听 |
鈥� |
% |
听 |
鈥� |
听 |
听 |
n/a |
听 |
Unsecured convertible senior notes |
听 |
听 |
260,591 |
听 |
听 |
6.25 |
% |
听 |
9.53 |
听 |
听 |
n/a |
听 |
Total borrowings |
听 |
$ |
10,942,563 |
听 |
听 |
听 |
听 |
听 |
听 |
听 |
|||
Borrowings by Collateral Type |
听 |
As of June 30, 2025 |
听 |
As of March 31, 2025 |
||||
(dollars in thousands) |
听 |
(unaudited) |
听 |
(unaudited) |
||||
Agency RMBS |
听 |
$ |
7,992,427 |
听 |
听 |
$ |
8,970,635 |
听 |
Mortgage servicing rights and related servicing advance obligations |
听 |
听 |
1,801,871 |
听 |
听 |
听 |
1,703,171 |
听 |
Other - secured |
听 |
听 |
9,470 |
听 |
听 |
听 |
8,166 |
听 |
Other - unsecured(1) |
听 |
听 |
371,811 |
听 |
听 |
听 |
260,591 |
听 |
Total |
听 |
听 |
10,175,579 |
听 |
听 |
听 |
10,942,563 |
听 |
TBA cost basis |
听 |
听 |
3,009,819 |
听 |
听 |
听 |
3,001,672 |
听 |
Net payable (receivable) for unsettled RMBS |
听 |
听 |
108,474 |
听 |
听 |
听 |
(643,896 |
) |
Total, including TBAs and net payable (receivable) for unsettled RMBS |
听 |
$ |
13,293,872 |
听 |
听 |
$ |
13,300,339 |
听 |
听 |
听 |
听 |
听 |
听 |
||||
Debt-to-equity ratio at period-end(2) |
听 |
5.4 :1.0 |
听 |
5.1 :1.0 |
||||
Economic debt-to-equity ratio at period-end(3) |
听 |
7.0 :1.0 |
听 |
6.2 :1.0 |
||||
听 |
听 |
听 |
听 |
听 |
||||
Cost of Financing by Collateral Type(4) |
听 |
Three Months Ended
|
听 |
Three Months Ended
|
||||
听 |
听 |
(unaudited) |
听 |
(unaudited) |
||||
Agency RMBS |
听 |
听 |
4.54 |
% |
听 |
听 |
4.62 |
% |
Mortgage servicing rights and related servicing advance obligations(5) |
听 |
听 |
7.87 |
% |
听 |
听 |
7.81 |
% |
Other - secured |
听 |
听 |
6.68 |
% |
听 |
听 |
6.93 |
% |
Other - unsecured(1)(5) |
听 |
听 |
7.44 |
% |
听 |
听 |
6.84 |
% |
Annualized cost of financing |
听 |
听 |
5.18 |
% |
听 |
听 |
5.27 |
% |
Interest rate swaps(6) |
听 |
听 |
(0.20 |
)% |
听 |
听 |
(0.18 |
)% |
|
听 |
听 |
(0.10 |
)% |
听 |
听 |
(0.04 |
)% |
TBAs(8) |
听 |
听 |
2.65 |
% |
听 |
听 |
2.89 |
% |
Annualized cost of financing, including swaps, |
听 |
听 |
4.43 |
% |
听 |
听 |
4.49 |
% |
____________________ |
|
(1) |
Unsecured borrowings under senior notes and convertible senior notes. |
(2) |
Defined as total borrowings to fund Agency and non-Agency investment securities, MSR and related servicing advances and mortgage loans held-for-sale, divided by total equity. |
(3) |
Defined as total borrowings to fund Agency and non-Agency investment securities, MSR and related servicing advances and mortgage loans held-for-sale, plus the implied debt on net TBA cost basis and net payable (receivable) for unsettled RMBS, divided by total equity. |
(4) |
Excludes any repurchase agreements collateralized by |
(5) |
Includes amortization of debt issuance costs. |
(6) |
The cost of financing on interest rate swaps held to mitigate interest rate risk associated with the company鈥檚 outstanding borrowings includes interest spread income/expense and amortization of upfront payments made or received upon entering into interest rate swap agreements and is calculated using average borrowings balance as the denominator. |
(7) |
The cost of financing on |
(8) |
The implied financing benefit/cost of dollar roll income on TBAs is calculated using the average cost basis of TBAs as the denominator. TBA dollar roll income is the non-GAAP economic equivalent to holding and financing Agency RMBS using short-term repurchase agreements. TBAs are accounted for as derivative instruments in accordance with GAAP. |
Conference Call
TWO will host a conference call on July 29, 2025 at 9:00 a.m. ET to discuss its second quarter 2025 financial results and related information. To participate in the teleconference, please call toll-free (888) 394-8218 approximately 10 minutes prior to the above start time and provide the Conference Code 3889089. The conference call will also be webcast live and accessible online in the News & Events section of the company鈥檚 website at . For those unable to attend, a replay of the webcast will be available on the company鈥檚 website approximately four hours after the live call ends.
About TWO
Two Harbors Investment Corp., or TWO, a
Forward-Looking Statements
This release includes 鈥渇orward-looking statements鈥� within the meaning of the safe harbor provisions of the United States Private Securities Litigation Reform Act of 1995. Actual results may differ from expectations, estimates and projections and, consequently, readers should not rely on these forward-looking statements as predictions of future events. Words such as 鈥渆xpect,鈥� 鈥渢arget,鈥� 鈥渁ssume,鈥� 鈥渆stimate,鈥� 鈥減roject,鈥� 鈥渂udget,鈥� 鈥渇orecast,鈥� 鈥渁nticipate,鈥� 鈥渋ntend,鈥� 鈥減lan,鈥� 鈥渕ay,鈥� 鈥渨ill,鈥� 鈥渃ould,鈥� 鈥渟hould,鈥� 鈥渂elieve,鈥� 鈥減redicts,鈥� 鈥減otential,鈥� 鈥渃ontinue,鈥� and similar expressions are intended to identify such forward-looking statements. These forward-looking statements involve significant risks and uncertainties that could cause actual results to differ materially from expected results, including, among other things, those described in our Annual Report on Form 10-K for the year ended December 31, 2024, and any subsequent Quarterly Reports on Form 10-Q, under the caption 鈥淩isk Factors.鈥� Factors that could cause actual results to differ include, but are not limited to: the state of credit markets and general economic conditions; changes in interest rates and the market value of our assets; changes in prepayment rates of mortgages underlying our target assets; the rates of default or decreased recovery on the mortgages underlying our target assets; declines in home prices; our ability to establish, adjust and maintain appropriate hedges for the risks in our portfolio; the availability and cost of our target assets; the availability and cost of financing; changes in the competitive landscape within our industry; our ability to effectively execute and to realize the benefits of strategic transactions and initiatives we have pursued or may in the future pursue; our decision to terminate our management agreement with PRCM Advisers LLC and the ongoing litigation related to such termination; our ability to manage various operational risks and costs associated with our business, including the risks associated with operating a mortgage loan servicer and originator; interruptions in or impairments to our communications and information technology systems; our ability to acquire MSR and to maintain our MSR portfolio; our exposure to legal and regulatory claims; legislative and regulatory actions affecting our business; our ability to maintain our REIT qualification; and limitations imposed on our business due to our REIT status and our exempt status under the Investment Company Act of 1940.
Readers are cautioned not to place undue reliance upon any forward-looking statements, which speak only as of the date made. TWO does not undertake or accept any obligation to release publicly any updates or revisions to any forward-looking statement to reflect any change in its expectations or any change in events, conditions or circumstances on which any such statement is based. Additional information concerning these and other risk factors is contained in TWO鈥檚 most recent filings with the Securities and Exchange Commission (SEC). All subsequent written and oral forward-looking statements concerning TWO or matters attributable to TWO or any person acting on its behalf are expressly qualified in their entirety by the cautionary statements above.
Non-GAAP Financial Measures
In addition to disclosing financial results calculated in accordance with
Additional Information
Stockholders of TWO and other interested persons may find additional information regarding the company at , at the Securities and Exchange Commission鈥檚 internet site at or by directing requests to: TWO, Attn: Investor Relations, 1601 Utica Avenue South, Suite 900,
| 听 | |||||||
听TWO HARBORS INVESTMENT CORP. |
|||||||
CONSOLIDATED BALANCE SHEETS |
|||||||
(dollars in thousands, except share data) |
|||||||
听 |
June 30,
|
听 |
December 31,
|
||||
听 |
(unaudited) |
听 |
听 |
||||
ASSETS |
听 |
听 |
听 |
||||
Available-for-sale securities, at fair value (amortized cost |
$ |
8,320,757 |
听 |
听 |
$ |
7,371,711 |
听 |
Mortgage servicing rights, at fair value |
听 |
3,015,643 |
听 |
听 |
听 |
2,994,271 |
听 |
Mortgage loans held-for-sale |
听 |
9,888 |
听 |
听 |
听 |
2,334 |
听 |
Cash and cash equivalents |
听 |
657,816 |
听 |
听 |
听 |
504,613 |
听 |
Restricted cash |
听 |
140,481 |
听 |
听 |
听 |
313,028 |
听 |
Accrued interest receivable |
听 |
36,768 |
听 |
听 |
听 |
33,331 |
听 |
Due from counterparties |
听 |
285,570 |
听 |
听 |
听 |
386,464 |
听 |
Derivative assets, at fair value |
听 |
88,651 |
听 |
听 |
听 |
10,114 |
听 |
Reverse repurchase agreements |
听 |
228,587 |
听 |
听 |
听 |
355,975 |
听 |
Other assets |
听 |
174,977 |
听 |
听 |
听 |
232,478 |
听 |
Total Assets |
$ |
12,959,138 |
听 |
听 |
$ |
12,204,319 |
听 |
LIABILITIES AND STOCKHOLDERS鈥� EQUITY |
听 |
听 |
听 |
||||
Liabilities: |
听 |
听 |
听 |
||||
Repurchase agreements |
$ |
8,782,622 |
听 |
听 |
$ |
7,805,057 |
听 |
Revolving credit facilities |
听 |
1,011,871 |
听 |
听 |
听 |
1,020,171 |
听 |
Warehouse lines of credit |
听 |
9,275 |
听 |
听 |
听 |
2,032 |
听 |
Senior notes |
听 |
110,867 |
听 |
听 |
听 |
鈥� |
听 |
Convertible senior notes |
听 |
260,944 |
听 |
听 |
听 |
260,229 |
听 |
Derivative liabilities, at fair value |
听 |
2,701 |
听 |
听 |
听 |
24,897 |
听 |
Due to counterparties |
听 |
388,508 |
听 |
听 |
听 |
648,643 |
听 |
Dividends payable |
听 |
54,195 |
听 |
听 |
听 |
58,725 |
听 |
Accrued interest payable |
听 |
80,167 |
听 |
听 |
听 |
85,994 |
听 |
Loss contingency accrual |
听 |
199,935 |
听 |
听 |
听 |
鈥� |
听 |
Other liabilities |
听 |
172,027 |
听 |
听 |
听 |
176,062 |
听 |
Total Liabilities |
听 |
11,273,047 |
听 |
听 |
听 |
10,081,810 |
听 |
Stockholders鈥� Equity: |
听 |
听 |
听 |
||||
Preferred stock, par value |
听 |
601,467 |
听 |
听 |
听 |
601,467 |
听 |
Common stock, par value |
听 |
1,041 |
听 |
听 |
听 |
1,037 |
听 |
Additional paid-in capital |
听 |
5,945,210 |
听 |
听 |
听 |
5,936,609 |
听 |
Accumulated other comprehensive loss |
听 |
(112,879 |
) |
听 |
听 |
(320,524 |
) |
Cumulative earnings |
听 |
1,310,689 |
听 |
听 |
听 |
1,648,785 |
听 |
Cumulative distributions to stockholders |
听 |
(5,859,502 |
) |
听 |
听 |
(5,744,865 |
) |
Total Stockholders鈥� Equity |
听 |
1,886,026 |
听 |
听 |
听 |
2,122,509 |
听 |
Total Liabilities and Stockholders鈥� Equity |
$ |
13,159,073 |
听 |
听 |
$ |
12,204,319 |
听 |
| 听 | |||||||||||||||
听TWO HARBORS INVESTMENT CORP. |
|||||||||||||||
CONSOLIDATED STATEMENTS OF COMPREHENSIVE (LOSS) INCOME |
|||||||||||||||
(dollars in thousands, except share data) |
|||||||||||||||
Certain prior period amounts have been reclassified to conform to the current period presentation |
|||||||||||||||
听 |
Three Months Ended |
听 |
Six Months Ended |
||||||||||||
听 |
June 30, |
听 |
June 30, |
||||||||||||
听 |
听 |
2025 |
听 |
听 |
听 |
2024 |
听 |
听 |
听 |
2025 |
听 |
听 |
听 |
2024 |
听 |
听 |
(unaudited) |
听 |
(unaudited) |
||||||||||||
Net interest expense: |
听 |
听 |
听 |
听 |
听 |
||||||||||
Interest income |
$ |
117,082 |
听 |
听 |
$ |
115,953 |
听 |
听 |
$ |
228,464 |
听 |
听 |
$ |
233,736 |
听 |
Interest expense |
听 |
135,205 |
听 |
听 |
听 |
154,207 |
听 |
听 |
听 |
266,919 |
听 |
听 |
听 |
314,207 |
听 |
Net interest expense |
听 |
(18,123 |
) |
听 |
听 |
(38,254 |
) |
听 |
听 |
(38,455 |
) |
听 |
听 |
(80,471 |
) |
Net servicing income: |
听 |
听 |
听 |
听 |
听 |
听 |
听 |
||||||||
Servicing income |
听 |
158,354 |
听 |
听 |
听 |
176,015 |
听 |
听 |
听 |
315,213 |
听 |
听 |
听 |
342,348 |
听 |
Servicing costs |
听 |
2,386 |
听 |
听 |
听 |
4,475 |
听 |
听 |
听 |
5,583 |
听 |
听 |
听 |
11,594 |
听 |
Net servicing income |
听 |
155,968 |
听 |
听 |
听 |
171,540 |
听 |
听 |
听 |
309,630 |
听 |
听 |
听 |
330,754 |
听 |
Other (loss) income: |
听 |
听 |
听 |
听 |
听 |
听 |
听 |
||||||||
Loss on investment securities |
听 |
(32,830 |
) |
听 |
听 |
(22,437 |
) |
听 |
听 |
(65,559 |
) |
听 |
听 |
(33,412 |
) |
Loss on servicing asset |
听 |
(35,902 |
) |
听 |
听 |
(22,857 |
) |
听 |
听 |
(72,123 |
) |
听 |
听 |
(11,845 |
) |
(Loss) gain on interest rate swap and swaption agreements |
听 |
(52,950 |
) |
听 |
听 |
22,012 |
听 |
听 |
听 |
(151,738 |
) |
听 |
听 |
120,522 |
听 |
(Loss) gain on other derivative instruments |
听 |
(31,257 |
) |
听 |
听 |
(750 |
) |
听 |
听 |
(29,809 |
) |
听 |
听 |
46,849 |
听 |
Gain (loss) on mortgage loans held-for-sale |
听 |
883 |
听 |
听 |
听 |
鈥� |
听 |
听 |
听 |
1,552 |
听 |
听 |
听 |
(3 |
) |
Other income |
听 |
1,038 |
听 |
听 |
听 |
226 |
听 |
听 |
听 |
1,799 |
听 |
听 |
听 |
226 |
听 |
Total other (loss) income |
听 |
(151,018 |
) |
听 |
听 |
(23,806 |
) |
听 |
听 |
(315,878 |
) |
听 |
听 |
122,337 |
听 |
Expenses: |
听 |
听 |
听 |
听 |
听 |
听 |
听 |
||||||||
Compensation and benefits |
听 |
21,469 |
听 |
听 |
听 |
21,244 |
听 |
听 |
听 |
48,058 |
听 |
听 |
听 |
47,773 |
听 |
Other operating expenses |
听 |
21,307 |
听 |
听 |
听 |
17,699 |
听 |
听 |
听 |
41,812 |
听 |
听 |
听 |
38,751 |
听 |
Loss contingency accrual |
听 |
199,935 |
听 |
听 |
听 |
鈥� |
听 |
听 |
听 |
199,935 |
听 |
听 |
听 |
鈥� |
听 |
Total expenses |
听 |
242,711 |
听 |
听 |
听 |
38,943 |
听 |
听 |
听 |
289,805 |
听 |
听 |
听 |
86,524 |
听 |
(Loss) income before income taxes |
听 |
(255,884 |
) |
听 |
听 |
70,537 |
听 |
听 |
听 |
(334,508 |
) |
听 |
听 |
286,096 |
听 |
Provision for income taxes |
听 |
1,661 |
听 |
听 |
听 |
14,201 |
听 |
听 |
听 |
2,092 |
听 |
听 |
听 |
26,172 |
听 |
Net (loss) income |
听 |
(257,545 |
) |
听 |
听 |
56,336 |
听 |
听 |
听 |
(336,600 |
) |
听 |
听 |
259,924 |
听 |
Dividends on preferred stock |
听 |
(13,239 |
) |
听 |
听 |
(11,784 |
) |
听 |
听 |
(26,425 |
) |
听 |
听 |
(23,568 |
) |
Gain on repurchase and retirement of preferred stock |
听 |
鈥� |
听 |
听 |
听 |
鈥� |
听 |
听 |
听 |
鈥� |
听 |
听 |
听 |
644 |
听 |
Net (loss) income attributable to common stockholders |
$ |
(270,784 |
) |
听 |
$ |
44,552 |
听 |
听 |
$ |
(363,025 |
) |
听 |
$ |
237,000 |
听 |
Basic (loss) earnings per weighted average common share |
$ |
(2.62 |
) |
听 |
$ |
0.43 |
听 |
听 |
$ |
(3.51 |
) |
听 |
$ |
2.27 |
听 |
Diluted (loss) earnings per weighted average common share |
$ |
(2.62 |
) |
听 |
$ |
0.43 |
听 |
听 |
$ |
(3.51 |
) |
听 |
$ |
2.16 |
听 |
Comprehensive (loss) income: |
听 |
听 |
听 |
听 |
听 |
听 |
听 |
||||||||
Net (loss) income |
$ |
(259,041 |
) |
听 |
$ |
56,336 |
听 |
听 |
$ |
(338,096 |
) |
听 |
$ |
259,924 |
听 |
Other comprehensive income (loss): |
听 |
听 |
听 |
听 |
听 |
听 |
听 |
||||||||
Unrealized gain (loss) on available-for-sale securities |
听 |
50,473 |
听 |
听 |
听 |
(44,073 |
) |
听 |
听 |
207,645 |
听 |
听 |
听 |
(147,151 |
) |
Other comprehensive income (loss) |
听 |
50,473 |
听 |
听 |
听 |
(44,073 |
) |
听 |
听 |
207,645 |
听 |
听 |
听 |
(147,151 |
) |
Comprehensive (loss) income |
听 |
(208,568 |
) |
听 |
听 |
12,263 |
听 |
听 |
听 |
(130,451 |
) |
听 |
听 |
112,773 |
听 |
Dividends on preferred stock |
听 |
(13,239 |
) |
听 |
听 |
(11,784 |
) |
听 |
听 |
(26,425 |
) |
听 |
听 |
(23,568 |
) |
Gain on repurchase and retirement of preferred stock |
听 |
鈥� |
听 |
听 |
听 |
鈥� |
听 |
听 |
听 |
鈥� |
听 |
听 |
听 |
644 |
听 |
Comprehensive (loss) income attributable to common stockholders |
$ |
(221,807 |
) |
听 |
$ |
479 |
听 |
听 |
$ |
(156,876 |
) |
听 |
$ |
89,849 |
听 |
| 听 | |||||||||||||||
听TWO HARBORS INVESTMENT CORP. |
|||||||||||||||
INTEREST INCOME AND INTEREST EXPENSE |
|||||||||||||||
(dollars in thousands, except share data) |
|||||||||||||||
听 |
|||||||||||||||
听 |
Three Months Ended |
听 |
Six Months Ended |
||||||||||||
听 |
June 30, |
听 |
June 30, |
||||||||||||
听 |
听 |
2025 |
听 |
听 |
听 |
2024 |
听 |
听 |
听 |
2025 |
听 |
听 |
听 |
2024 |
听 |
听 |
(unaudited) |
听 |
(unaudited) |
||||||||||||
Interest income: |
听 |
听 |
听 |
听 |
听 |
||||||||||
Available-for-sale securities |
$ |
108,842 |
听 |
听 |
$ |
99,211 |
听 |
听 |
$ |
209,260 |
听 |
听 |
$ |
199,816 |
听 |
Mortgage loans held-for-sale |
听 |
145 |
听 |
听 |
听 |
3 |
听 |
听 |
听 |
198 |
听 |
听 |
听 |
4 |
听 |
Other |
听 |
8,095 |
听 |
听 |
听 |
16,739 |
听 |
听 |
听 |
19,006 |
听 |
听 |
听 |
33,916 |
听 |
Total interest income |
听 |
117,082 |
听 |
听 |
听 |
115,953 |
听 |
听 |
听 |
228,464 |
听 |
听 |
听 |
233,736 |
听 |
Interest expense: |
听 |
听 |
听 |
听 |
听 |
听 |
听 |
||||||||
Repurchase agreements |
听 |
110,288 |
听 |
听 |
听 |
113,714 |
听 |
听 |
听 |
217,366 |
听 |
听 |
听 |
232,430 |
听 |
Revolving credit facilities |
听 |
20,343 |
听 |
听 |
听 |
29,906 |
听 |
听 |
听 |
40,469 |
听 |
听 |
听 |
60,153 |
听 |
Warehouse lines of credit |
听 |
129 |
听 |
听 |
听 |
鈥� |
听 |
听 |
听 |
184 |
听 |
听 |
听 |
鈥� |
听 |
Term notes payable |
听 |
鈥� |
听 |
听 |
听 |
6,008 |
听 |
听 |
听 |
鈥� |
听 |
听 |
听 |
12,426 |
听 |
Senior notes |
听 |
1,496 |
听 |
听 |
听 |
鈥� |
听 |
听 |
听 |
1,496 |
听 |
听 |
听 |
鈥� |
听 |
Convertible senior notes |
听 |
4,445 |
听 |
听 |
听 |
4,579 |
听 |
听 |
听 |
8,900 |
听 |
听 |
听 |
9,198 |
听 |
Total interest expense |
听 |
136,701 |
听 |
听 |
听 |
154,207 |
听 |
听 |
听 |
268,415 |
听 |
听 |
听 |
314,207 |
听 |
Net interest expense |
$ |
(19,619 |
) |
听 |
$ |
(38,254 |
) |
听 |
$ |
(39,951 |
) |
听 |
$ |
(80,471 |
) |
| 听 | |||||||
听TWO HARBORS INVESTMENT CORP. |
|||||||
RECONCILIATION OF GAAP TO NON-GAAP FINANCIAL INFORMATION |
|||||||
(dollars in thousands, except share data) |
|||||||
Certain prior period amounts have been reclassified to conform to the current period presentation |
|||||||
听 |
听 |
听 |
听 |
||||
听 |
Three Months Ended |
||||||
听 |
June 30,
|
听 |
March 31,
|
||||
听 |
(unaudited) |
听 |
(unaudited) |
||||
Reconciliation of comprehensive (loss) income to Earnings Available for Distribution: |
听 |
听 |
听 |
||||
Comprehensive (loss) income attributable to common stockholders |
$ |
(221,807 |
) |
听 |
$ |
64,931 |
听 |
Adjustment for other comprehensive income attributable to common stockholders: |
听 |
听 |
听 |
||||
Unrealized gain on available-for-sale securities |
听 |
(50,473 |
) |
听 |
听 |
(157,172 |
) |
Net loss attributable to common stockholders |
$ |
(272,280 |
) |
听 |
$ |
(92,241 |
) |
Adjustments to exclude reported realized and unrealized (gains) losses: |
听 |
听 |
听 |
||||
AG真人官方ized loss on securities |
听 |
32,599 |
听 |
听 |
听 |
33,661 |
听 |
Unrealized loss (gain) on securities |
听 |
347 |
听 |
听 |
听 |
(1,026 |
) |
(Reversal of) provision for credit losses |
听 |
(116 |
) |
听 |
听 |
94 |
听 |
AG真人官方ized and unrealized loss on mortgage servicing rights |
听 |
35,902 |
听 |
听 |
听 |
36,221 |
听 |
AG真人官方ized loss (gain) on termination or expiration of interest rate swaps and swaptions |
听 |
30,298 |
听 |
听 |
听 |
(26,587 |
) |
Unrealized loss on interest rate swaps and swaptions |
听 |
29,034 |
听 |
听 |
听 |
131,350 |
听 |
AG真人官方ized and unrealized loss (gain) on other derivative instruments |
听 |
32,606 |
听 |
听 |
听 |
(1,329 |
) |
Other adjustments: |
听 |
听 |
听 |
||||
MSR amortization(1) |
听 |
(73,983 |
) |
听 |
听 |
(70,303 |
) |
TBA dollar roll income (losses)(2) |
听 |
6,181 |
听 |
听 |
听 |
8,178 |
听 |
|
听 |
3,358 |
听 |
听 |
听 |
1,272 |
听 |
Change in servicing reserves |
听 |
64 |
听 |
听 |
听 |
(105 |
) |
Non-cash equity compensation expense |
听 |
1,932 |
听 |
听 |
听 |
6,523 |
听 |
Certain operating expenses(4) |
听 |
2,754 |
听 |
听 |
听 |
106 |
听 |
Loss contingency accrual |
听 |
199,935 |
听 |
听 |
听 |
鈥� |
听 |
Net provision for (benefit from) income taxes on non-EAD |
听 |
914 |
听 |
听 |
听 |
(722 |
) |
Earnings available for distribution to common stockholders(5) |
$ |
29,545 |
听 |
听 |
$ |
25,092 |
听 |
Weighted average basic common shares |
听 |
104,084,326 |
听 |
听 |
听 |
103,976,437 |
听 |
Earnings available for distribution to common stockholders per weighted average basic common share |
$ |
0.28 |
听 |
听 |
$ |
0.24 |
听 |
_____________ |
|
(1) |
MSR amortization refers to the portion of change in fair value of MSR primarily attributed to the realization of expected cash flows (runoff) of the portfolio, which is deemed a non-GAAP measure due to the company鈥檚 decision to account for MSR at fair value. |
(2) |
TBA dollar roll income is the economic equivalent to holding and financing Agency RMBS using short-term repurchase agreements. |
(3) |
|
(4) |
Certain operating expenses predominantly consists of expenses incurred in connection with the company鈥檚 ongoing litigation with PRCM Advisers LLC. |
(5) |
EAD is a non-GAAP measure that we define as comprehensive (loss) income attributable to common stockholders, excluding realized and unrealized gains and losses on the aggregate investment portfolio, gains and losses on repurchases of preferred stock, provision for (reversal of) credit losses, reserve expense for representation and warranty obligations on MSR, non-cash compensation expense related to restricted common stock, certain operating expenses and loss contingency accrual. As defined, EAD includes net interest income, accrual and settlement of interest on derivatives, dollar roll income on TBAs, |
听
View source version on businesswire.com:
Margaret Karr, Head of Investor Relations, TWO, (612) 453-4080, [email protected]
Source: Two Harbors Investment Corp.