LexinFintech Holdings Ltd. Reports Second Quarter 2025��Unaudited Financial Results
LexinFintech (NASDAQ:LX), a Chinese personal financial service enabler, reported strong Q2 2025 results with net income reaching RMB511 million, up 126% year-over-year and 19% quarter-over-quarter. Total revenue was RMB3.6 billion, with loan originations of RMB53 billion.
The company announced several shareholder-friendly initiatives, including a dividend of US$0.194 per ADS for H1 2025, an increased dividend payout ratio to 30% for H2 2025, and a US$50 million share repurchase program. The CEO also committed to personally purchase up to US$10 million worth of ADSs.
Key operational metrics showed improvement with 236 million registered users (up 7.9% YoY), while the 90-day+ delinquency ratio improved to 3.1%. The company maintained its guidance for significant year-over-year net income growth in 2025.
LexinFintech (NASDAQ:LX), un fornitore cinese di servizi finanziari personali, ha riportato risultati solidi nel secondo trimestre del 2025 con un utile netto di 511 milioni di RMB, in aumento del 126% su base annua e del 19% rispetto al trimestre precedente. Il fatturato totale è stato di 3,6 miliardi di RMB, con erogazioni di prestiti pari a 53 miliardi di RMB.
L'azienda ha annunciato diverse iniziative a favore degli azionisti, tra cui un dividendo di 0,194 USD per ADS per la prima metà del 2025, un aumento del payout del dividendo al 30% per la seconda metà del 2025 e un programma di riacquisto di azioni per 50 milioni di USD. Il CEO si è inoltre impegnato a comprare personalmente ADS per un valore fino a 10 milioni di USD.
I principali indicatori operativi hanno mostrato miglioramenti con 236 milioni di utenti registrati (in crescita del 7,9% su base annua), mentre il tasso di insolvenza oltre i 90 giorni è migliorato al 3,1%. L’azienda ha confermato le previsioni di una significativa crescita annua dell’utile netto per il 2025.
LexinFintech (NASDAQ:LX), un proveedor chino de servicios financieros personales, reportó sólidos resultados en el segundo trimestre de 2025 con un ingreso neto de 511 millones de RMB, un aumento del 126% interanual y del 19% respecto al trimestre anterior. Los ingresos totales fueron de 3.6 mil millones de RMB, con originaciones de préstamos por 53 mil millones de RMB.
La compañía anunció varias iniciativas favorables para los accionistas, incluyendo un dividendo de 0.194 USD por ADS para el primer semestre de 2025, un aumento en la tasa de pago de dividendos al 30% para el segundo semestre de 2025 y un programa de recompra de acciones por 50 millones de USD. El CEO también se comprometió a comprar personalmente ADS por un valor de hasta 10 millones de USD.
Los principales indicadores operativos mostraron mejoras con 236 millones de usuarios registrados (un aumento del 7.9% interanual), mientras que la tasa de morosidad a más de 90 días mejoró a 3.1%. La compañía mantuvo su guía para un crecimiento significativo del ingreso neto interanual en 2025.
LexinFintech (NASDAQ:LX)�� 중국�� 개인 금융 서비�� 제공업체��, 2025�� 2분기�� 순이�� 5�� 1,100�� 위안�� 기록하며 전년 대�� 126%, 전분�� 대�� 19% 증가�� 강력�� 실적�� 보고했습니다. �� 수익은 36�� 위안이며, 대�� 실행액은 530�� 위안�� 달했습니��.
회사�� 주주 친화�� 정책으로 2025�� 상반�� ADS�� 0.194달러 배당�� 지��, 하반�� 배당성향 30% 상향, 그리�� 5,000�� 달러 규모�� 자사�� 매입 프로그램�� 발표했습니다. CEO�� 최대 1,000�� 달러 상당�� ADS�� 개인적으�� 매입하겠다고 약속했습니다.
주요 운영 지표도 개선되어 2�� 3,600�� 명의 등록 사용��(전년 대�� 7.9% 증가)�� 기록했으��, 90�� 이상 연체율은 3.1%�� 개선되었습니��. 회사�� 2025�� 연간 순이익의 �� �� 성장�� 위한 가이던스를 유지했습니다.
LexinFintech (NASDAQ:LX), un fournisseur chinois de services financiers personnels, a annoncé de solides résultats pour le deuxième trimestre 2025 avec un revenu net atteignant 511 millions de RMB, en hausse de 126 % en glissement annuel et de 19 % par rapport au trimestre précédent. Le chiffre d'affaires total s'est élevé à 3,6 milliards de RMB, avec des octrois de prêts de 53 milliards de RMB.
L'entreprise a annoncé plusieurs initiatives favorables aux actionnaires, notamment un dividende de 0,194 USD par ADS pour le premier semestre 2025, une augmentation du taux de distribution des dividendes à 30 % pour le second semestre 2025, ainsi qu'un programme de rachat d'actions de 50 millions USD. Le PDG s'est également engagé à acheter personnellement jusqu'à 10 millions USD d'ADS.
Les principaux indicateurs opérationnels ont montré des améliorations avec 236 millions d'utilisateurs enregistrés (en hausse de 7,9 % en glissement annuel), tandis que le taux de défaillance à plus de 90 jours s'est amélioré à 3,1 %. L'entreprise a maintenu ses prévisions de croissance significative du revenu net en glissement annuel pour 2025.
LexinFintech (NASDAQ:LX), ein chinesischer Anbieter persönlicher Finanzdienstleistungen, meldete starke Ergebnisse für das zweite Quartal 2025 mit einem Nettoeinkommen von 511 Millionen RMB, was einem Anstieg von 126 % im Jahresvergleich und 19 % im Quartalsvergleich entspricht. Der Gesamtumsatz betrug 3,6 Milliarden RMB, mit Kreditvergaben in Höhe von 53 Milliarden RMB.
Das Unternehmen kündigte mehrere aktionärsfreundliche Maßnahmen an, darunter eine Dividende von 0,194 USD pro ADS für das erste Halbjahr 2025, eine Erhöhung der Dividendenquote auf 30 % für das zweite Halbjahr 2025 sowie ein Aktienrückkaufprogramm im Wert von 50 Millionen USD. Der CEO verpflichtete sich außerdem, persönlich ADS im Wert von bis zu 10 Millionen USD zu erwerben.
Wichtige operative Kennzahlen verbesserten sich mit 236 Millionen registrierten Nutzern (plus 7,9 % im Jahresvergleich), während die Ausfallquote über 90 Tage auf 3,1 % sank. Das Unternehmen bestätigte seine Prognose für ein signifikantes Wachstum des Nettoergebnisses im Jahresvergleich für 2025.
- Net income increased 126% YoY to RMB511 million, reaching a 14-quarter high
- Announced US$50 million share repurchase program plus CEO's US$10 million personal share purchase commitment
- Increased dividend payout ratio from 25% to 30% for H2 2025
- 90-day+ delinquency ratio improved to 3.1% from 3.3% in previous quarter
- Tech-empowerment service income grew 55.3% YoY to RMB830 million
- Active user base grew 12.6% YoY to 4.7 million users
- Total operating revenue decreased 1.5% YoY to RMB3,587 million
- Credit facilitation service income declined 15% YoY to RMB2,270 million
- Total outstanding loan balance decreased 8.1% YoY to RMB106 billion
- Sales and marketing expenses increased 21.4% YoY to RMB567 million
Insights
LexinFintech posts record quarterly net income of RMB511M, up 126% YoY, with dividend and share repurchase programs signaling management confidence.
LexinFintech delivered exceptional profitability in Q2 2025, with
Revenue reached
Loan originations of
The user base continues expanding, with registered users growing
Most compelling is management's confidence signaled through shareholder returns: a
SHENZHEN, China, Aug. 07, 2025 (GLOBE NEWSWIRE) -- LexinFintech Holdings Ltd. (“Lexin�� or the “Company��) (NASDAQ: LX), a leading technology-empowered personal financial service enabler in China, today announced its unaudited financial results for the quarter ended June 30, 2025.
Mr. Jay Wenjie Xiao, Chairman and Chief Executive Officer of Lexin, commented, “Building upon our risk management enhancements, operational refinement, and unique business ecosystem advantages, we continued to deliver robust performance for the second quarter of 2025, demonstrating our operational resilience against uncertain external environment.
In the second quarter, revenue achieved a quarter-over-quarter increase of
Looking ahead, we’ll further strengthen our customer-centric approach to enhance customer experience and attract quality customers, leverage our business ecosystem advantages to drive greater synergies, and deploy AI across operations to bolster efficiency. Amid the current macroeconomic and industry landscape, we will maintain our prudent strategy with a dual focus on safeguarding asset quality and driving profitability growth. Although external uncertainties remain, we reaffirm our full-year guidance of delivering strong year-over-year net income growth.
The management has always placed great emphasis on shareholder returns. In accordance with our dividend policy, the board of directors has approved a dividend of US
Mr. James Zheng, Chief Financial Officer of Lexin, commented, “In the second quarter, our performance continued to progress steadily as planned in our business turnaround road-map. Net income reached RMB511 million, representing a
Second Quarter 2025 Operational Highlights:
User Base
- Total number of registered users reached 236 million as of June 30,��2025, representing an increase of
7.9% from 219 million as of June 30,��2024, and users with credit lines reached 47.2 million as of June 30,��2025, up by8.9% from 43.3 million as of June 30,��2024. - Number of active users1 who used our loan products in the second quarter of 2025 was 4.7 million, representing an increase of
12.6% from 4.2 million in the second quarter of 2024. - Number of cumulative borrowers with successful drawdown was 35.2 million as of June 30,��2025, an increase of
8.2% from 32.5 million as of June 30,��2024.
Loan Facilitation Business
- As of June 30,��2025, we cumulatively originated RMB1,429.6 billion in loans, an increase of
17.0% from RMB1,222.2 billion as of June 30,��2024.
- Total loan originations2 in the second quarter of 2025 was RMB52.9 billion, an increase of
3.5% from RMB51.1 billion in the second quarter of 2024. - Total outstanding principal balance of loans3 was RMB106 billion as of June 30,��2025, representing a decrease of
8.1% from RMB115 billion as of June 30,��2024.
Credit Performance4
- 90 day+ delinquency ratio5 was
3.1% as of June 30,��2025, as compared with3.3% as of March 31, 2025. - First payment default rate (30 day+) for new loan originations was below
1% as of June 30,��2025.
Installment E-commerce Platform Service
- GMV6 in the second quarter of 2025 for our installment e-commerce platform service was RMB2,029 million, representing an increase of
117% from RMB933 million in the second quarter of 2024. - In the second quarter of 2025, our installment e-commerce platform service served over 460,000 users and around 180 merchants.
Other Operational Highlights
- The weighted average tenor of loans originated on our platform in the second quarter of 2025 was approximately 13.2 months, as compared with 12.8 months in the second quarter of 2024.
- Repeated borrowers�� contribution7 of loans across our platform for the second quarter of 2025 was
86.1% .
Second Quarter 2025 Financial Highlights:
- Total operating revenue was RMB3,587 million, representing a decrease of
1.5% from the second quarter of 2024. - Credit facilitation service income was RMB2,270 million, representing a decrease of
15.0% from the second quarter of 2024. Tech-empowerment service income was RMB830 million, representing an increase of55.3% from the second quarter of 2024. Installment e-commerce platform service income was RMB487 million, representing an increase of11.5% from the second quarter of 2024. - Net income attributable to ordinary shareholders of the Company was RMB511 million, representing an increase of
126% from the second quarter of 2024. Net income per ADS attributable to ordinary shareholders of the Company was RMB2.85 on a fully diluted basis. - Adjusted net income attributable to ordinary shareholders of the Company8 was RMB541 million, representing an increase of
116% from the second quarter of 2024. Adjusted net income per ADS attributable to ordinary shareholders of the Company8 was RMB3.02 on a fully diluted basis.
__________________________
- Active users refer to, for a specified period, users who made at least one transaction during that period through our platform or through our third-party partners�� platforms using the credit line granted by us.
- Total loan originations refer to the total principal amount of loans facilitated and originated during the given period.
- Total outstanding principal balance of loans refers to the total amount of principal outstanding for loans facilitated and originated at the end of each period,including loans guaranteed by our financial guarantee companies and excluding loans delinquent for more than 180 days.
- Loans under Intelligent Credit Platform are excluded from the calculation of credit performance. Intelligent Credit Platform (ICP) is an intelligent platform on our “Fenqile�� app, under which we match borrowers and financial institutions through big data and cloud computing technology. For loans facilitated through ICP, the Company does not bear principal risk.
- ��90 day+ delinquency rate�� refers to the outstanding principal balance of on- and off-balance sheet loans that were 91 to 180 calendar days past due as a percentage of the total outstanding principal balance of on- and off-balance sheet loans across our platform as of a specific date. Loans that are charged-off and loans under “ICP�� and overseas are not included in the delinquency rate calculation.
- GMV refers to the total value of transactions completed for products purchased on our e-commerce and Maiya channel, net of returns.
- Repeated borrowers�� contribution for a given period refers to the principal amount of loans borrowed during that period by borrowers who had previously made at least one successful drawdown as a percentage of the total loan facilitation and origination volume through our platform during that period.
- Adjusted net income attributable to ordinary shareholders of the Company, adjusted net income per ordinary share and per ADS attributable to ordinary shareholders of the Company are non-GAAP financial measures. For more information on non-GAAP financial measures, please see the section of “Use of Non-GAAP Financial Measures Statement�� and the tables captioned “Unaudited Reconciliations of GAAP and Non-GAAP Results�� set forth at the end of this press release.
Second Quarter 2025 Financial Results:
Operating revenue was RMB3,587 million in the second quarter of 2025, as compared to RMB3,641 million in the second quarter of 2024.
Credit facilitation service income was RMB2,270 million in the second quarter of 2025, as compared to RMB2,669 million in the second quarter of 2024. The decrease was due to the decrease in guarantee income and loan facilitation and servicing fees-credit oriented, partially offset by the increases in financing income.
Loan facilitation and servicing fees-credit oriented was RMB1,131 million in the second quarter of 2025, as compared to RMB1,433 million in the second quarter of 2024. The decrease was primarily due to the decrease in the APR of off-balance sheet loans, as well as the increase in the early repayment behaviors.
Guarantee income was RMB571 million in the second quarter of 2025, as compared to RMB722 million in the second quarter of 2024. The decrease was primarily due to the decrease of outstanding balances in the off-balance sheet loans funded by certain institutional funding partners, which are accounted for under ASC 460, Guarantees.
Financing income was RMB568 million in the second quarter of 2025, as compared to RMB513 million in the second quarter of 2024. The increase was primarily driven by the increase in the origination of on-balance sheet loans.
Tech-empowerment service income was RMB830 million in the second quarter of 2025, as compared to RMB535 million in the second quarter of 2024. The increase was primarily driven by the increase of loan facilitation volume through ICP and the increase of referral services.
Installment e-commerce platform service income was RMB487 million in the second quarter of 2025, as compared to RMB437 million in the second quarter of 2024. The increase was primarily driven by the increase in transaction volume.
Cost of sales consisted of cost of inventory sold and other costs. Cost of sales was RMB426 million in the second quarter of 2025, as compared to RMB423 million in the second quarter of 2024.
Funding cost was RMB59.9 million in the second quarter of 2025, as compared to RMB90.5 million in the second quarter of 2024. The decrease was primarily driven by the decrease in funding rates and balance of funding debts to fund the on-balance sheet loans.
Processing and servicing costs was RMB606 million in the second quarter of 2025, as compared to RMB519 million in the second quarter of 2024. The increase was primarily driven by an increase in risk management expenses.
Provision for financing receivables was RMB257 million for the second quarter of 2025, as compared to RMB171 million for the second quarter of 2024. The increase was primarily due to the increase in the outstanding loan balances of on-balance sheet loans, including the increase in the outstanding loan balances of oversea business.
Provision for contract assets and receivables was RMB164 million in the second quarter of 2025, as compared to RMB155 million in the second quarter of 2024.
Provision for contingent guarantee liabilities was RMB802 million in the second quarter of 2025, as compared to RMB935 million in the second quarter of 2024. The decrease was primarily driven by the improvement of credit risk performance and the decrease of outstanding balances in the off-balance sheet loans funded by certain institutional funding partners, which are accounted for under ASC 460, Guarantees.
Gross profit was RMB1,273 million in the second quarter of 2025, as compared to RMB1,348 million in the second quarter of 2024.
Sales and marketing expenses was RMB567 million in the second quarter of 2025, as compared to RMB467 million in the second quarter of 2024. This increase was primarily due to an increase in online advertising costs.
Research and development expenses was RMB158 million in the second quarter of 2025, as compared to RMB143 million in the second quarter of 2024. The increase was primarily due to increased investment in technology development.
General and administrative expenses was RMB96.0 million in the second quarter of 2025, as compared to RMB100 million in the second quarter of 2024.
Change in fair value of financial guarantee derivatives and loans at fair value was a gain of RMB184 million in the second quarter of 2025, as compared to a loss of RMB368 million in the second quarter of 2024. The change was primarily driven by the fair value gains realized as a result of the release of guarantee obligation as loans are repaid, partially offset by the fair value loss from the re-measurement of the expected loss rates.
Income tax expense was RMB120 million in the second quarter of 2025, as compared to RMB60.0 million in the second quarter of 2024. The increase was primarily due to the increase in income before income tax expense.
Net income was RMB511 million in the second quarter of 2025, as compared to RMB227 million in the second quarter of 2024.
Recent Development
Semi-Annual Dividend
The board of directors of the Company has approved a dividend of US
According to the updated dividend policy approved by the Board on May 19, 2025, starting from the second half of 2025, cash dividend payout is raised to
Share Repurchase Plan and Management Purchase
On July 21, 2025, the Company announced a US
Alongside the share repurchase program, Mr. Jay Wenjie Xiao, Chairman and Chief Executive Officer of the Company planned to use his personal funds to purchase up to US
Management Changes
Mr. Erwin Yong Lu has tendered his resignation as the Chief Technology Officer of the Company for family and personal reasons, effective September 30, 2025. The Company thanks him for his contribution.
Business Outlook
Looking ahead, despite evolving market and industry conditions, based on our current assessment, we maintain our performance guidance, expecting net income for the full year 2025 to achieve a significant year-over-year growth. The forecast is subject to the impact of macroeconomic factors, and we may adjust the performance outlook as appropriate based on evolving circumstances.
Conference Call
The Company’s management will host an earnings conference call at 7:00AM U.S. Eastern time on August 7, 2025 (7:00 PM Beijing/Hong Kong time on August 7, 2025).
Participants who wish to join the conference call should register online at:
https://s1.c-conf.com/diamondpass/10049362-fg8h6t.html
Once registration is completed, each participant will receive the dial-in number and a unique access PIN for the conference call.
Participants joining the conference call should dial in at least 10 minutes before the scheduled start time.
A live and archived webcast of the conference call will also be available at the Company's investor relations website at http://ir.lexin.com.
About LexinFintech Holdings Ltd.
We are a leading credit technology-empowered personal financial service enabler. Our mission is to use technology and risk management expertise to make financing more accessible for young generation consumers. We strive to achieve this mission by connecting consumers with financial institutions, where we facilitate through a unique model that includes online and offline channels, installment consumption platform, big data and AI driven credit risk management capabilities, as well as smart user and loan management systems. We also empower financial institutions by providing cutting-edge proprietary technology solutions to meet their needs of financial digital transformation.
For more information, please visit .
To follow us on Twitter, please go to: .
Use of Non-GAAP Financial Measures Statement
In evaluating our business, we consider and use adjusted net income attributable to ordinary shareholders of the Company, non-GAAP EBIT, adjusted net income per ordinary share and per ADS attributable to ordinary shareholders of the Company, four non-GAAP measures, as supplemental measures to review and assess our operating performance. The presentation of the non-GAAP financial measures is not intended to be considered in isolation or as a substitute for the financial information prepared and presented in accordance with U.S. GAAP. We define adjusted net income attributable to ordinary shareholders of the Company as net income attributable to ordinary shareholders of the Company excluding share-based compensation expenses, interest expense associated with convertible notes, and investment income/(loss) and we define non-GAAP EBIT as net income excluding income tax expense, share-based compensation expenses, interest expense, net, and investment income/(loss).
We present these non-GAAP financial measures because they are used by our management to evaluate our operating performance and formulate business plans. Adjusted net income attributable to ordinary shareholders of the Company enables our management to assess our operating results without considering the impact of share-based compensation expenses, interest expense associated with convertible notes, and investment income/(loss). Non-GAAP EBIT, on the other hand, enables our management to assess our operating results without considering the impact of income tax expense, share-based compensation expenses, interest expense, net, and investment income/(loss). We also believe that the use of these non-GAAP financial measures facilitates investors�� assessment of our operating performance. These non-GAAP financial measures are not defined under U.S. GAAP and are not presented in accordance with U.S. GAAP.
These non-GAAP financial measures have limitations as an analytical tool. One of the key limitations of using adjusted net income attributable to ordinary shareholders of the Company and non-GAAP EBIT is that they do not reflect all items of income and expense that affect our operations. Share-based compensation expenses, interest expense associated with convertible notes, income tax expense, interest expense, net, and investment income/(loss) have been and may continue to be incurred in our business and are not reflected in the presentation of adjusted net income attributable to ordinary shareholders of the Company and non-GAAP EBIT. Further, these non-GAAP financial measures may differ from the non-GAAP financial information used by other companies, including peer companies, and therefore their comparability may be limited.
We compensate for these limitations by reconciling each of the non-GAAP financial measures to the most directly comparable U.S. GAAP financial measure, which should be considered when evaluating our performance. We encourage you to review our financial information in its entirety and not rely on a single financial measure.
Exchange Rate Information Statement
This announcement contains translations of certain RMB amounts into U.S. dollars (“US$��) at specified rates solely for the convenience of the reader. Unless otherwise stated, all translations from RMB to US$ were made at the rate of RMB7.1636 to US
Safe Harbor Statement
This announcement contains forward-looking statements. These statements are made under the “safe harbor�� provisions of the U.S. Private Securities Litigation Reform Act of 1995. Statements that are not historical facts, including statements about Lexin’s beliefs and expectations, are forward-looking statements. These forward-looking statements can be identified by terminology such as “will,�� �� expects,�� “anticipates,�� “future,�� “intends,�� “plans,�� “believes,�� “estimates,�� “confident�� and similar statements. Among other things, the expectation of the collection efficiency and delinquency, business outlook and quotations from management in this announcement, contain forward-looking statements. Lexin may also make written or oral forward-looking statements in its periodic reports to the U.S. Securities and Exchange Commission (the “SEC��), in its annual report to shareholders, in press releases and other written materials and in oral statements made by its officers, directors or employees to third parties. Forward-looking statements involve inherent risks and uncertainties. A number of factors could cause actual results to differ materially from those contained in any forward-looking statement, including but not limited to the following: Lexin’s goal and strategies; Lexin’s expansion plans; Lexin’s future business development, financial condition and results of operations; Lexin’s expectation regarding demand for, and market acceptance of, its credit and investment management products; Lexin’s expectations regarding keeping and strengthening its relationship with borrowers, institutional funding partners, merchandise suppliers and other parties it collaborates with; general economic and business conditions; and assumptions underlying or related to any of the foregoing. Further information regarding these and other risks is included in Lexin’s filings with the SEC. All information provided in this press release and in the attachments is as of the date of this press release, and Lexin does not undertake any obligation to update any forward-looking statement, except as required under applicable law.
For investor and media inquiries, please contact:
LexinFintech Holdings Ltd.
IR inquiries:
Will Tan
Tel: +86 (755) 3637-8888 ext. 6258
E-mail: [email protected]
Media inquiries:
Ruifeng Xu
Tel: +86 (755) 3637-8888 ext. 6993
E-mail: [email protected]
SOURCE LexinFintech Holdings Ltd.
| �� | |||||||||
| LexinFintech Holdings Ltd. Unaudited Condensed Consolidated Balance Sheets | |||||||||
| �� | �� | �� | |||||||
| �� | As of | �� | |||||||
| (In thousands) | December��31,��2024 | �� | June 30,��2025 | �� | |||||
| �� | RMB | �� | RMB | �� | US$ | �� | |||
| ASSETS | �� | �� | �� | �� | �� | �� | |||
| Current Assets | �� | �� | �� | �� | �� | �� | |||
| Cash and cash equivalents | �� | 2,254,213 | �� | �� | 2,077,282 | �� | �� | 289,977 | �� |
| Restricted cash | �� | 1,638,479 | �� | �� | 1,422,365 | �� | �� | 198,554 | �� |
| Restricted��term��deposit��and��short-term��investments | �� | 138,497 | �� | �� | 395,276 | �� | �� | 55,178 | �� |
| Short-term financing receivables, net(1) | �� | 4,668,715 | �� | �� | 5,427,917 | �� | �� | 757,708 | �� |
| Short-term contract assets and receivables, net(1) | �� | 5,448,057 | �� | �� | 4,663,987 | �� | �� | 651,067 | �� |
| Deposits to insurance companies and guarantee companies | �� | 2,355,343 | �� | �� | 2,201,097 | �� | �� | 307,261 | �� |
| Prepayments and other current assets | �� | 1,321,340 | �� | �� | 1,758,027 | �� | �� | 245,411 | �� |
| Amounts due from related parties | �� | 61,722 | �� | �� | 83,887 | �� | �� | 11,710 | �� |
| Inventories, net | �� | 22,345 | �� | �� | 29,886 | �� | �� | 4,172 | �� |
| Total Current Assets | �� | 17,908,711 | �� | �� | 18,059,724 | �� | �� | 2,521,038 | �� |
| Non-current Assets | �� | �� | �� | �� | �� | �� | |||
| Restricted cash | �� | 100,860 | �� | �� | 71,588 | �� | �� | 9,993 | �� |
| Long-term financing receivables, net(1) | �� | 112,427 | �� | �� | 90,781 | �� | �� | 12,673 | �� |
| Long-term contract assets and receivables, net(1) | �� | 317,402 | �� | �� | 283,031 | �� | �� | 39,510 | �� |
| Property, equipment and software, net | �� | 613,110 | �� | �� | 803,776 | �� | �� | 112,203 | �� |
| Land use rights, net | �� | 862,867 | �� | �� | 845,667 | �� | �� | 118,051 | �� |
| Long-term investments | �� | 284,197 | �� | �� | 239,498 | �� | �� | 33,433 | �� |
| Deferred tax assets | �� | 1,540,842 | �� | �� | 1,687,365 | �� | �� | 235,547 | �� |
| Other assets | �� | 500,363 | �� | �� | 433,358 | �� | �� | 60,494 | �� |
| Total Non-current Assets | �� | 4,332,068 | �� | �� | 4,455,064 | �� | �� | 621,904 | �� |
| TOTAL ASSETS | �� | 22,240,779 | �� | �� | 22,514,788 | �� | �� | 3,142,942 | �� |
| �� | �� | �� | �� | �� | �� | �� | |||
| LIABILITIES | �� | �� | �� | �� | �� | �� | |||
| Current liabilities | �� | �� | �� | �� | �� | �� | |||
| Accounts payable | �� | 74,443 | �� | �� | 72,045 | �� | �� | 10,057 | �� |
| Amounts due to related parties | �� | 10,927 | �� | �� | 13,431 | �� | �� | 1,875 | �� |
| Short-term��borrowings��and��current��portion��of��long-term��borrowings | �� | 690,772 | �� | �� | 841,506 | �� | �� | 117,470 | �� |
| Short-term funding debts | �� | 2,754,454 | �� | �� | 2,811,878 | �� | �� | 392,523 | �� |
| Deferred guarantee income | �� | 975,102 | �� | �� | 1,224,450 | �� | �� | 170,927 | �� |
| Contingent guarantee liabilities | �� | 1,079,000 | �� | �� | 675,974 | �� | �� | 94,362 | �� |
| Accruals and other current liabilities | �� | 4,019,676 | �� | �� | 3,938,086 | �� | �� | 549,734 | �� |
| Total Current Liabilities | �� | 9,604,374 | �� | �� | 9,577,370 | �� | �� | 1,336,948 | �� |
| Non-current Liabilities | �� | �� | �� | �� | �� | �� | |||
| Long-term borrowings | �� | 585,024 | �� | �� | 569,690 | �� | �� | 79,526 | �� |
| Long-term funding debts | �� | 1,197,211 | �� | �� | 653,349 | �� | �� | 91,204 | �� |
| Deferred tax liabilities | �� | 91,380 | �� | �� | 102,705 | �� | �� | 14,337 | �� |
| Other long-term liabilities | �� | 22,784 | �� | �� | 6,775 | �� | �� | 946 | �� |
| Total Non-current Liabilities | �� | 1,896,399 | �� | �� | 1,332,519 | �� | �� | 186,013 | �� |
| TOTAL LIABILITIES | �� | 11,500,773 | �� | �� | 10,909,889 | �� | �� | 1,522,961 | �� |
| Shareholders�� equity: | �� | �� | �� | �� | �� | �� | |||
| Class A Ordinary Shares | �� | 205 | �� | �� | 205 | �� | �� | 30 | �� |
| Class B Ordinary Shares | �� | 41 | �� | �� | 41 | �� | �� | 7 | �� |
| Treasury stock | �� | (328,764 | ) | �� | (293,815 | ) | �� | (41,015 | ) |
| Additional paid-in capital | �� | 3,314,866 | �� | �� | 3,348,303 | �� | �� | 467,405 | �� |
| Statutory reserves | �� | 1,178,309 | �� | �� | 1,178,309 | �� | �� | 164,484 | �� |
| Accumulated other comprehensive income | �� | (29,559 | ) | �� | (24,123 | ) | �� | (3,367 | ) |
| Retained earnings | �� | 6,604,908 | �� | �� | 7,395,979 | �� | �� | 1,032,437 | �� |
| Total shareholders�� equity | �� | 10,740,006 | �� | �� | 11,604,899 | �� | �� | 1,619,981 | �� |
| TOTAL LIABILITIES AND SHAREHOLDERS�� EQUITY | �� | 22,240,779 | �� | �� | 22,514,788 | �� | �� | 3,142,942 | �� |
__________________________
(1) Short-term financing receivables, net of allowance for credit losses of RMB102,124 and RMB168,484 as of December 31, 2024 and June 30,��2025, respectively.
Short-term contract assets and receivables, net of allowance for credit losses of RMB409,590 and RMB264,922 as of December 31, 2024 and June 30,��2025, respectively.
Long-term financing receivables, net of allowance for credit losses of RMB1,820 and RMB1,648 as of December 31, 2024 and June 30,��2025, respectively.
Long-term contract assets and receivables, net of allowance for credit losses of RMB30,919 and RMB16,523 as of December 31, 2024 and June 30,��2025, respectively.
| �� | |||||||||||||||||||
| LexinFintech Holdings Ltd. Unaudited Condensed Consolidated Statements of Operations | |||||||||||||||||||
| �� | �� | �� | �� | �� | �� | ||||||||||||||
| �� | For the Three Months Ended June 30, | �� | �� | For the Six Months Ended June 30, | �� | ||||||||||||||
| (In thousands, except for share and per share data) | 2024 | �� | 2025 | �� | �� | 2024 | �� | 2025 | �� | ||||||||||
| �� | RMB | �� | RMB | �� | US$ | �� | �� | RMB | �� | RMB | �� | US$ | �� | ||||||
| Operating revenue: | �� | �� | �� | �� | �� | �� | �� | �� | �� | �� | �� | �� | �� | ||||||
| Credit facilitation service income | �� | 2,669,093 | �� | �� | 2,269,846 | �� | �� | 316,858 | �� | �� | �� | 5,317,571 | �� | �� | 4,460,712 | �� | �� | 622,691 | �� |
| Loan facilitation and servicing fees-credit oriented | �� | 1,433,416 | �� | �� | 1,130,734 | �� | �� | 157,844 | �� | �� | �� | 2,850,664 | �� | �� | 2,266,963 | �� | �� | 316,456 | �� |
| Guarantee income | �� | 722,288 | �� | �� | 571,181 | �� | �� | 79,734 | �� | �� | �� | 1,466,539 | �� | �� | 1,118,995 | �� | �� | 156,206 | �� |
| Financing income | �� | 513,389 | �� | �� | 567,931 | �� | �� | 79,280 | �� | �� | �� | 1,000,368 | �� | �� | 1,074,754 | �� | �� | 150,030 | �� |
| Tech-empowerment service income | �� | 534,548 | �� | �� | 830,124 | �� | �� | 115,881 | �� | �� | �� | 896,091 | �� | �� | 1,454,974 | �� | �� | 203,107 | �� |
| Installment e-commerce platform service income | �� | 437,047 | �� | �� | 487,444 | �� | �� | 68,045 | �� | �� | �� | 668,956 | �� | �� | 775,827 | �� | �� | 108,301 | �� |
| Total operating revenue | �� | 3,640,688 | �� | �� | 3,587,414 | �� | �� | 500,784 | �� | �� | �� | 6,882,618 | �� | �� | 6,691,513 | �� | �� | 934,099 | �� |
| Operating cost | �� | �� | �� | �� | �� | �� | �� | �� | �� | �� | �� | �� | �� | ||||||
| Cost of sales | �� | (422,933 | ) | �� | (425,900 | ) | �� | (59,453 | ) | �� | �� | (658,680 | ) | �� | (687,932 | ) | �� | (96,032 | ) |
| Funding cost | �� | (90,525 | ) | �� | (59,940 | ) | �� | (8,367 | ) | �� | �� | (181,263 | ) | �� | (142,944 | ) | �� | (19,954 | ) |
| Processing and servicing cost | �� | (518,692 | ) | �� | (605,652 | ) | �� | (84,546 | ) | �� | �� | (1,106,423 | ) | �� | (1,156,793 | ) | �� | (161,482 | ) |
| Provision for financing receivables | �� | (170,974 | ) | �� | (256,857 | ) | �� | (35,856 | ) | �� | �� | (307,657 | ) | �� | (439,006 | ) | �� | (61,283 | ) |
| Provision for contract assets and receivables | �� | (154,778 | ) | �� | (164,224 | ) | �� | (22,925 | ) | �� | �� | (320,720 | ) | �� | (293,909 | ) | �� | (41,028 | ) |
| Provision��for��contingent��guarantee��liabilities | �� | (934,693 | ) | �� | (802,157 | ) | �� | (111,977 | ) | �� | �� | (1,763,070 | ) | �� | (1,479,337 | ) | �� | (206,507 | ) |
| Total operating cost | �� | (2,292,595 | ) | �� | (2,314,730 | ) | �� | (323,124 | ) | �� | �� | (4,337,813 | ) | �� | (4,199,921 | ) | �� | (586,286 | ) |
| Gross profit | �� | 1,348,093 | �� | �� | 1,272,684 | �� | �� | 177,660 | �� | �� | �� | 2,544,805 | �� | �� | 2,491,592 | �� | �� | 347,813 | �� |
| Operating expenses: | �� | �� | �� | �� | �� | �� | �� | �� | �� | �� | �� | �� | �� | ||||||
| Sales and marketing expenses | �� | (467,423 | ) | �� | (567,025 | ) | �� | (79,154 | ) | �� | �� | (885,040 | ) | �� | (1,060,153 | ) | �� | (147,992 | ) |
| Research and development expenses | �� | (143,250 | ) | �� | (157,680 | ) | �� | (22,011 | ) | �� | �� | (278,232 | ) | �� | (313,306 | ) | �� | (43,736 | ) |
| General and administrative expenses | �� | (100,434 | ) | �� | (96,010 | ) | �� | (13,402 | ) | �� | �� | (190,194 | ) | �� | (196,763 | ) | �� | (27,467 | ) |
| Total operating expenses | �� | (711,107 | ) | �� | (820,715 | ) | �� | (114,567 | ) | �� | �� | (1,353,466 | ) | �� | (1,570,222 | ) | �� | (219,195 | ) |
| Change in fair value of financial guarantee derivatives and loans at fair value | �� | (368,261 | ) | �� | 184,089 | �� | �� | 25,698 | �� | �� | �� | (684,184 | ) | �� | 258,728 | �� | �� | 36,117 | �� |
| Interest expense, net | �� | 1,988 | �� | �� | (4,621 | ) | �� | (645 | ) | �� | �� | (1,916 | ) | �� | (9,323 | ) | �� | (1,301 | ) |
| Investment income/(loss) | �� | 260 | �� | �� | (5,126 | ) | �� | (716 | ) | �� | �� | 350 | �� | �� | (16,825 | ) | �� | (2,349 | ) |
| Others, net | �� | 15,603 | �� | �� | 4,997 | �� | �� | 698 | �� | �� | �� | 36,028 | �� | �� | 8,829 | �� | �� | 1,232 | �� |
| Income before income tax expense | �� | 286,576 | �� | �� | 631,308 | �� | �� | 88,128 | �� | �� | �� | 541,617 | �� | �� | 1,162,779 | �� | �� | 162,317 | �� |
| Income tax expense | �� | (60,045 | ) | �� | (119,907 | ) | �� | (16,738 | ) | �� | �� | (113,463 | ) | �� | (221,054 | ) | �� | (30,858 | ) |
| Net income | �� | 226,531 | �� | �� | 511,401 | �� | �� | 71,390 | �� | �� | �� | 428,154 | �� | �� | 941,725 | �� | �� | 131,459 | �� |
| Net income attributable to ordinary shareholders of the Company | �� | 226,531 | �� | �� | 511,401 | �� | �� | 71,390 | �� | �� | �� | 428,154 | �� | �� | 941,725 | �� | �� | 131,459 | �� |
| �� | �� | �� | �� | �� | �� | �� | �� | �� | �� | �� | �� | �� | �� | ||||||
| Net income per ordinary share attributable to ordinary shareholders of the Company | �� | �� | �� | �� | �� | �� | �� | �� | �� | �� | �� | �� | �� | ||||||
| Basic | �� | 0.68 | �� | �� | 1.50 | �� | �� | 0.21 | �� | �� | �� | 1.30 | �� | �� | 2.78 | �� | �� | 0.39 | �� |
| Diluted | �� | 0.68 | �� | �� | 1.43 | �� | �� | 0.20 | �� | �� | �� | 1.30 | �� | �� | 2.62 | �� | �� | 0.37 | �� |
| �� | �� | �� | �� | �� | �� | �� | �� | �� | �� | �� | �� | �� | �� | ||||||
| Net income per ADS attributable to ordinary shareholders of the Company | �� | �� | �� | �� | �� | �� | �� | �� | �� | �� | �� | �� | �� | ||||||
| Basic | �� | 1.37 | �� | �� | 3.00 | �� | �� | 0.42 | �� | �� | �� | 2.59 | �� | �� | 5.55 | �� | �� | 0.77 | �� |
| Diluted | �� | 1.35 | �� | �� | 2.85 | �� | �� | 0.40 | �� | �� | �� | 2.59 | �� | �� | 5.25 | �� | �� | 0.73 | �� |
| �� | �� | �� | �� | �� | �� | �� | �� | �� | �� | �� | �� | �� | �� | ||||||
| Weighted average ordinary shares outstanding | �� | �� | �� | �� | �� | �� | �� | �� | �� | �� | �� | �� | �� | ||||||
| Basic | �� | 330,780,601 | �� | �� | 340,489,447 | �� | �� | 340,489,447 | �� | �� | �� | 330,528,871 | �� | �� | 339,288,258 | �� | �� | 339,288,258 | �� |
| Diluted | �� | 335,192,422 | �� | �� | 358,475,575 | �� | �� | 358,475,575 | �� | �� | �� | 334,421,262 | �� | �� | 359,067,911 | �� | �� | 359,067,911 | �� |
| �� | �� | �� | �� | �� | �� | �� | �� | �� | �� | �� | �� | �� | �� | �� | �� | �� | �� | �� | �� |
| �� | |||||||||||||||||||
| LexinFintech Holdings Ltd. Unaudited Condensed Consolidated Statements of Comprehensive Income | |||||||||||||||||||
| �� | �� | �� | �� | �� | �� | ||||||||||||||
| �� | For the Three Months Ended June 30, | �� | �� | For the Six Months Ended June 30, | �� | ||||||||||||||
| (In thousands) | 2024 | �� | 2025 | �� | �� | 2024 | �� | 2025 | �� | ||||||||||
| �� | RMB | �� | RMB | �� | US$ | �� | �� | RMB | �� | RMB | �� | US$ | �� | ||||||
| Net income | �� | 226,531 | �� | �� | 511,401 | �� | �� | 71,390 | �� | �� | �� | 428,154 | �� | �� | 941,725 | �� | �� | 131,459 | �� |
| Other comprehensive income | �� | �� | �� | �� | �� | �� | �� | �� | �� | �� | �� | �� | �� | ||||||
| Foreign currency translation adjustment, net of nil tax | �� | (13,554 | ) | �� | 7,695 | �� | �� | 1,074 | �� | �� | �� | (11,231 | ) | �� | 5,436 | �� | �� | 759 | �� |
| Total comprehensive income | �� | 212,977 | �� | �� | 519,096 | �� | �� | 72,464 | �� | �� | �� | 416,923 | �� | �� | 947,161 | �� | �� | 132,218 | �� |
| Total comprehensive income attributable to ordinary shareholders of the Company | �� | 212,977 | �� | �� | 519,096 | �� | �� | 72,464 | �� | �� | �� | 416,923 | �� | �� | 947,161 | �� | �� | 132,218 | �� |
| �� | �� | �� | �� | �� | �� | �� | �� | �� | �� | �� | �� | �� | �� | �� | �� | �� | �� | �� | �� |
| �� | |||||||||||||||||||
| LexinFintech Holdings Ltd. Unaudited Reconciliations of GAAP and Non-GAAP Results | |||||||||||||||||||
| �� | �� | �� | �� | �� | �� | ||||||||||||||
| �� | For the Three Months Ended June 30, | �� | �� | For the Six Months Ended June 30, | �� | ||||||||||||||
| (In thousands, except for share and per share data) | 2024 | �� | 2025 | �� | �� | 2024 | �� | 2025 | �� | ||||||||||
| �� | RMB | �� | RMB | �� | US$ | �� | �� | RMB | �� | RMB | �� | US$ | �� | ||||||
| Reconciliation of Adjusted net income attributable to ordinary shareholders of the Company to Net income attributable to ordinary shareholders of the Company | �� | �� | �� | �� | �� | �� | �� | �� | �� | �� | �� | �� | �� | ||||||
| Net income attributable to ordinary shareholders of the Company | �� | 226,531 | �� | �� | 511,401 | �� | �� | 71,390 | �� | �� | �� | 428,154 | �� | �� | 941,725 | �� | �� | 131,459 | �� |
| Add: Share-based compensation expenses | �� | 23,119 | �� | �� | 24,183 | �� | �� | 3,376 | �� | �� | �� | 46,393 | �� | �� | 53,724 | �� | �� | 7,500 | �� |
| Interest expense associated with convertible notes | �� | 373 | �� | �� | - | �� | �� | - | �� | �� | �� | 5,695 | �� | �� | - | �� | �� | - | �� |
| Investment (income)/loss | �� | (260 | ) | �� | 5,126 | �� | �� | 716 | �� | �� | �� | (350 | ) | �� | 16,825 | �� | �� | 2,349 | �� |
| Adjusted net income attributable to ordinary shareholders of the Company | �� | 249,763 | �� | �� | 540,710 | �� | �� | 75,482 | �� | �� | �� | 479,892 | �� | �� | 1,012,274 | �� | �� | 141,308 | �� |
| �� | �� | �� | �� | �� | �� | �� | �� | �� | �� | �� | �� | �� | �� | ||||||
| Adjusted net income per ordinary share attributable to ordinary shareholders of the Company | �� | �� | �� | �� | �� | �� | �� | �� | �� | �� | �� | �� | �� | ||||||
| Basic | �� | 0.76 | �� | �� | 1.59 | �� | �� | 0.22 | �� | �� | �� | 1.45 | �� | �� | 2.98 | �� | �� | 0.42 | �� |
| Diluted | �� | 0.75 | �� | �� | 1.51 | �� | �� | 0.21 | �� | �� | �� | 1.43 | �� | �� | 2.82 | �� | �� | 0.39 | �� |
| �� | �� | �� | �� | �� | �� | �� | �� | �� | �� | �� | �� | �� | �� | ||||||
| Adjusted net income per ADS attributable to ordinary shareholders of the Company | �� | �� | �� | �� | �� | �� | �� | �� | �� | �� | �� | �� | �� | ||||||
| Basic | �� | 1.51 | �� | �� | 3.18 | �� | �� | 0.44 | �� | �� | �� | 2.90 | �� | �� | 5.97 | �� | �� | 0.83 | �� |
| Diluted | �� | 1.49 | �� | �� | 3.02 | �� | �� | 0.42 | �� | �� | �� | 2.87 | �� | �� | 5.64 | �� | �� | 0.79 | �� |
| �� | �� | �� | �� | �� | �� | �� | �� | �� | �� | �� | �� | �� | �� | ||||||
| Weighted average shares used in calculating net income per ordinary share for non-GAAP EPS | �� | �� | �� | �� | �� | �� | �� | �� | �� | �� | �� | �� | �� | ||||||
| Basic | �� | 330,780,601 | �� | �� | 340,489,447 | �� | �� | 340,489,447 | �� | �� | �� | 330,528,871 | �� | �� | 339,288,258 | �� | �� | 339,288,258 | �� |
| Diluted | �� | 335,192,422 | �� | �� | 358,475,575 | �� | �� | 358,475,575 | �� | �� | �� | 334,421,262 | �� | �� | 359,067,911 | �� | �� | 359,067,911 | �� |
| �� | �� | �� | �� | �� | �� | �� | �� | �� | �� | �� | �� | �� | �� | ||||||
| Reconciliations of Non-GAAP EBIT to Net income | �� | �� | �� | �� | �� | �� | �� | �� | �� | �� | �� | �� | �� | ||||||
| Net income | �� | 226,531 | �� | �� | 511,401 | �� | �� | 71,390 | �� | �� | �� | 428,154 | �� | �� | 941,725 | �� | �� | 131,459 | �� |
| Add: Income tax expense | �� | 60,045 | �� | �� | 119,907 | �� | �� | 16,738 | �� | �� | �� | 113,463 | �� | �� | 221,054 | �� | �� | 30,858 | �� |
| Share-based compensation expenses | �� | 23,119 | �� | �� | 24,183 | �� | �� | 3,376 | �� | �� | �� | 46,393 | �� | �� | 53,724 | �� | �� | 7,500 | �� |
| Interest expense, net | �� | (1,988 | ) | �� | 4,621 | �� | �� | 645 | �� | �� | �� | 1,916 | �� | �� | 9,323 | �� | �� | 1,301 | �� |
| Investment (income)/loss | �� | (260 | ) | �� | 5,126 | �� | �� | 716 | �� | �� | �� | (350 | ) | �� | 16,825 | �� | �� | 2,349 | �� |
| Non-GAAP EBIT | �� | 307,447 | �� | �� | 665,238 | �� | �� | 92,865 | �� | �� | �� | 589,576 | �� | �� | 1,242,651 | �� | �� | 173,467 | �� |
| �� | �� | �� | �� | �� | �� | �� | �� | �� | �� | �� | �� | �� | �� | �� | �� | �� | �� | �� | �� |
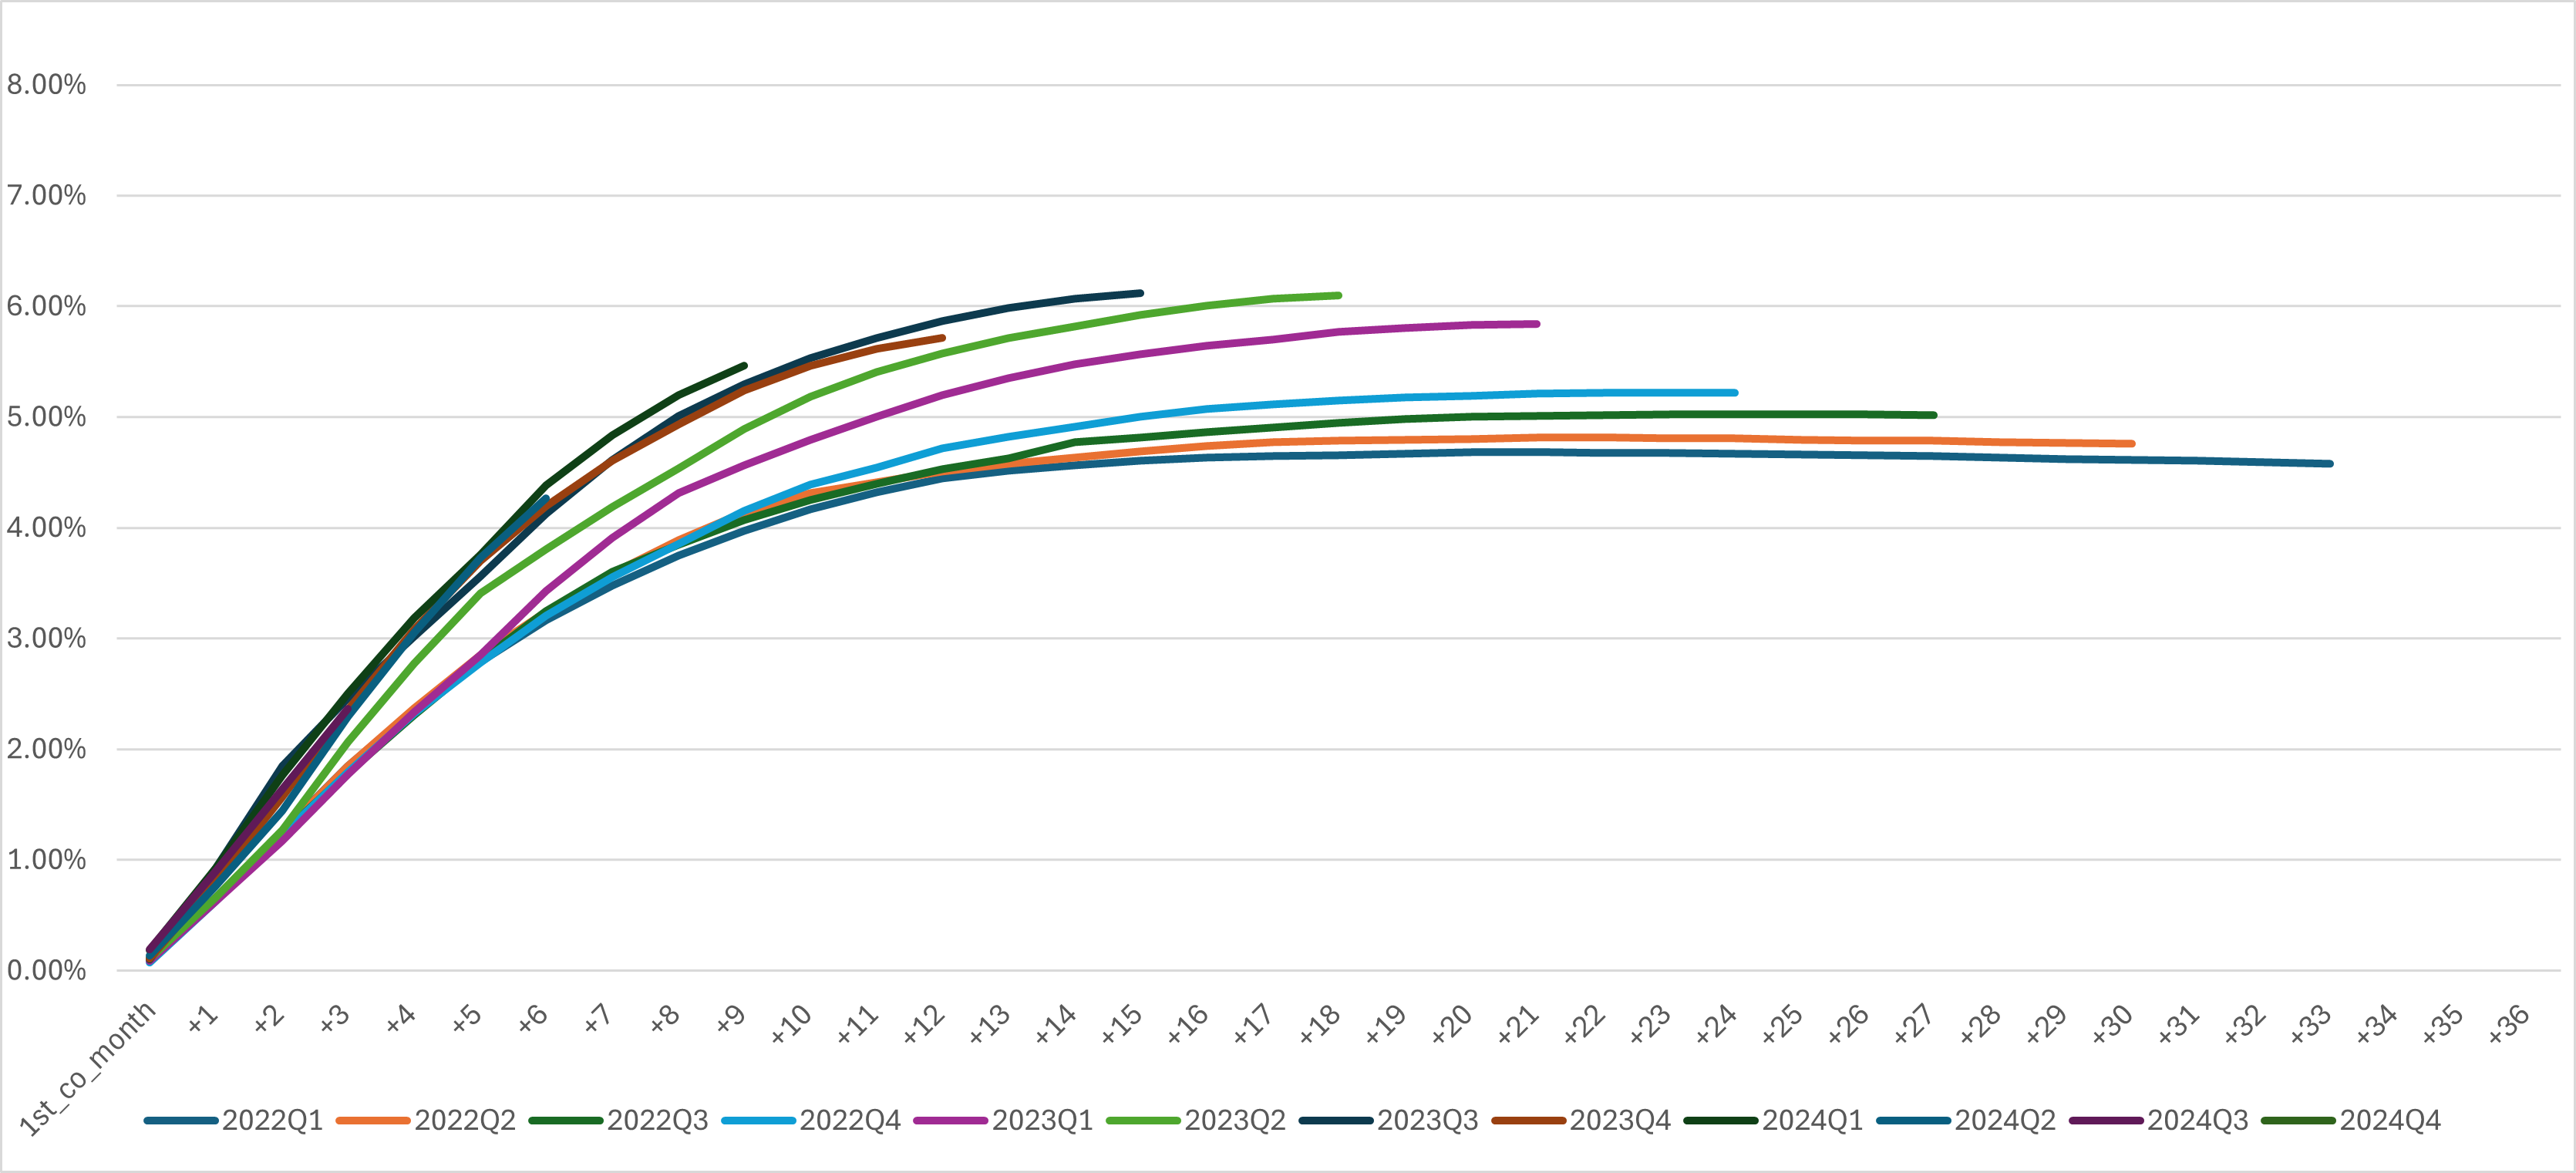
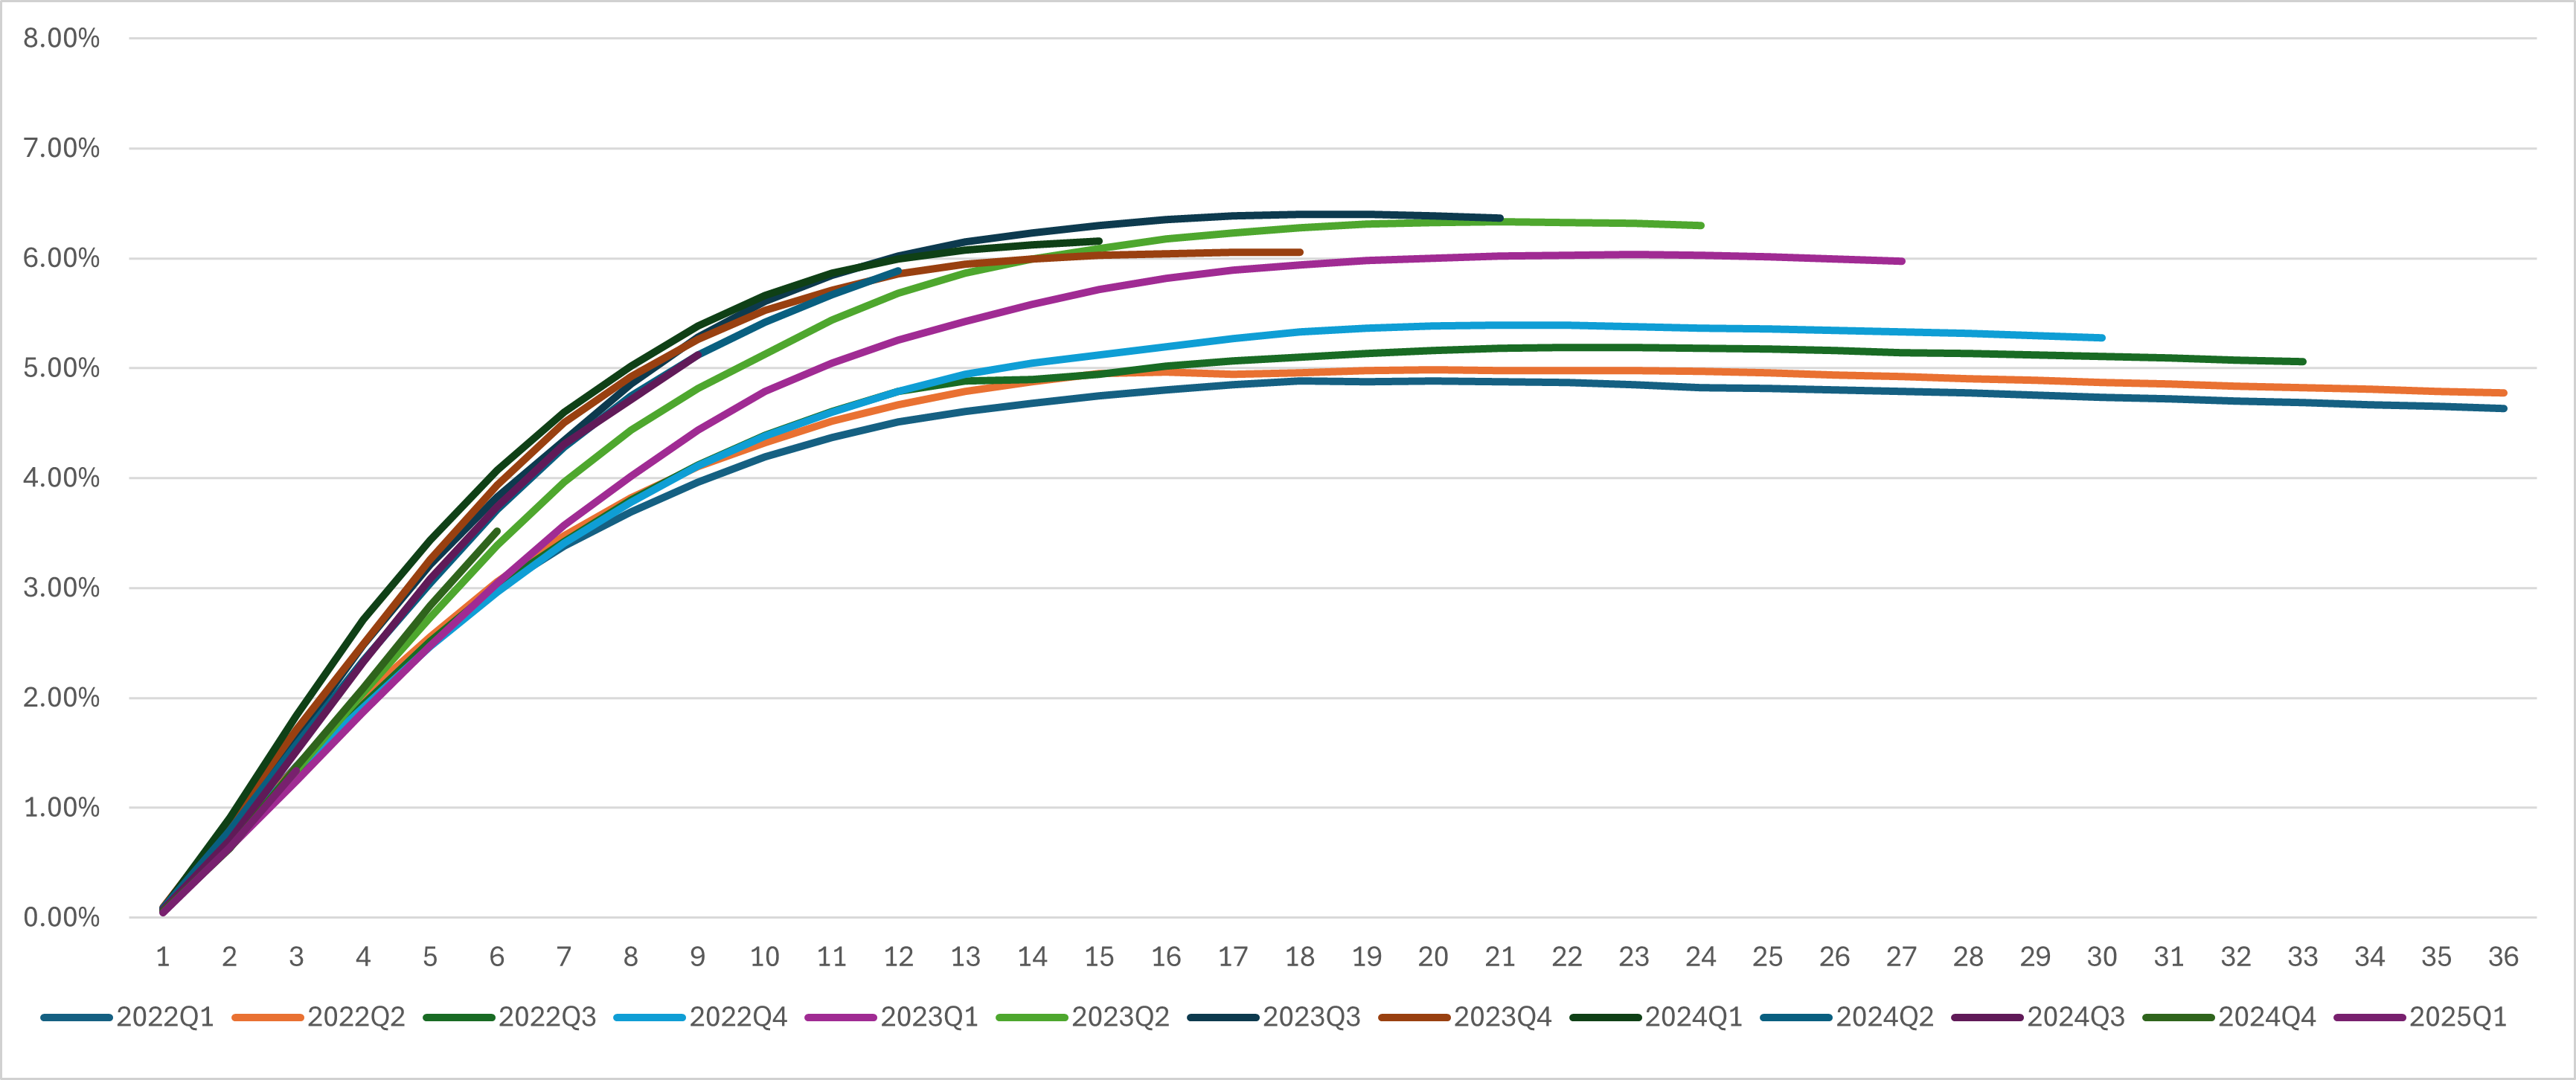
Additional Credit Information
Vintage Charge Off Curve1
Dpd30+/GMV by Performance Windows1
First Payment Default 30+1
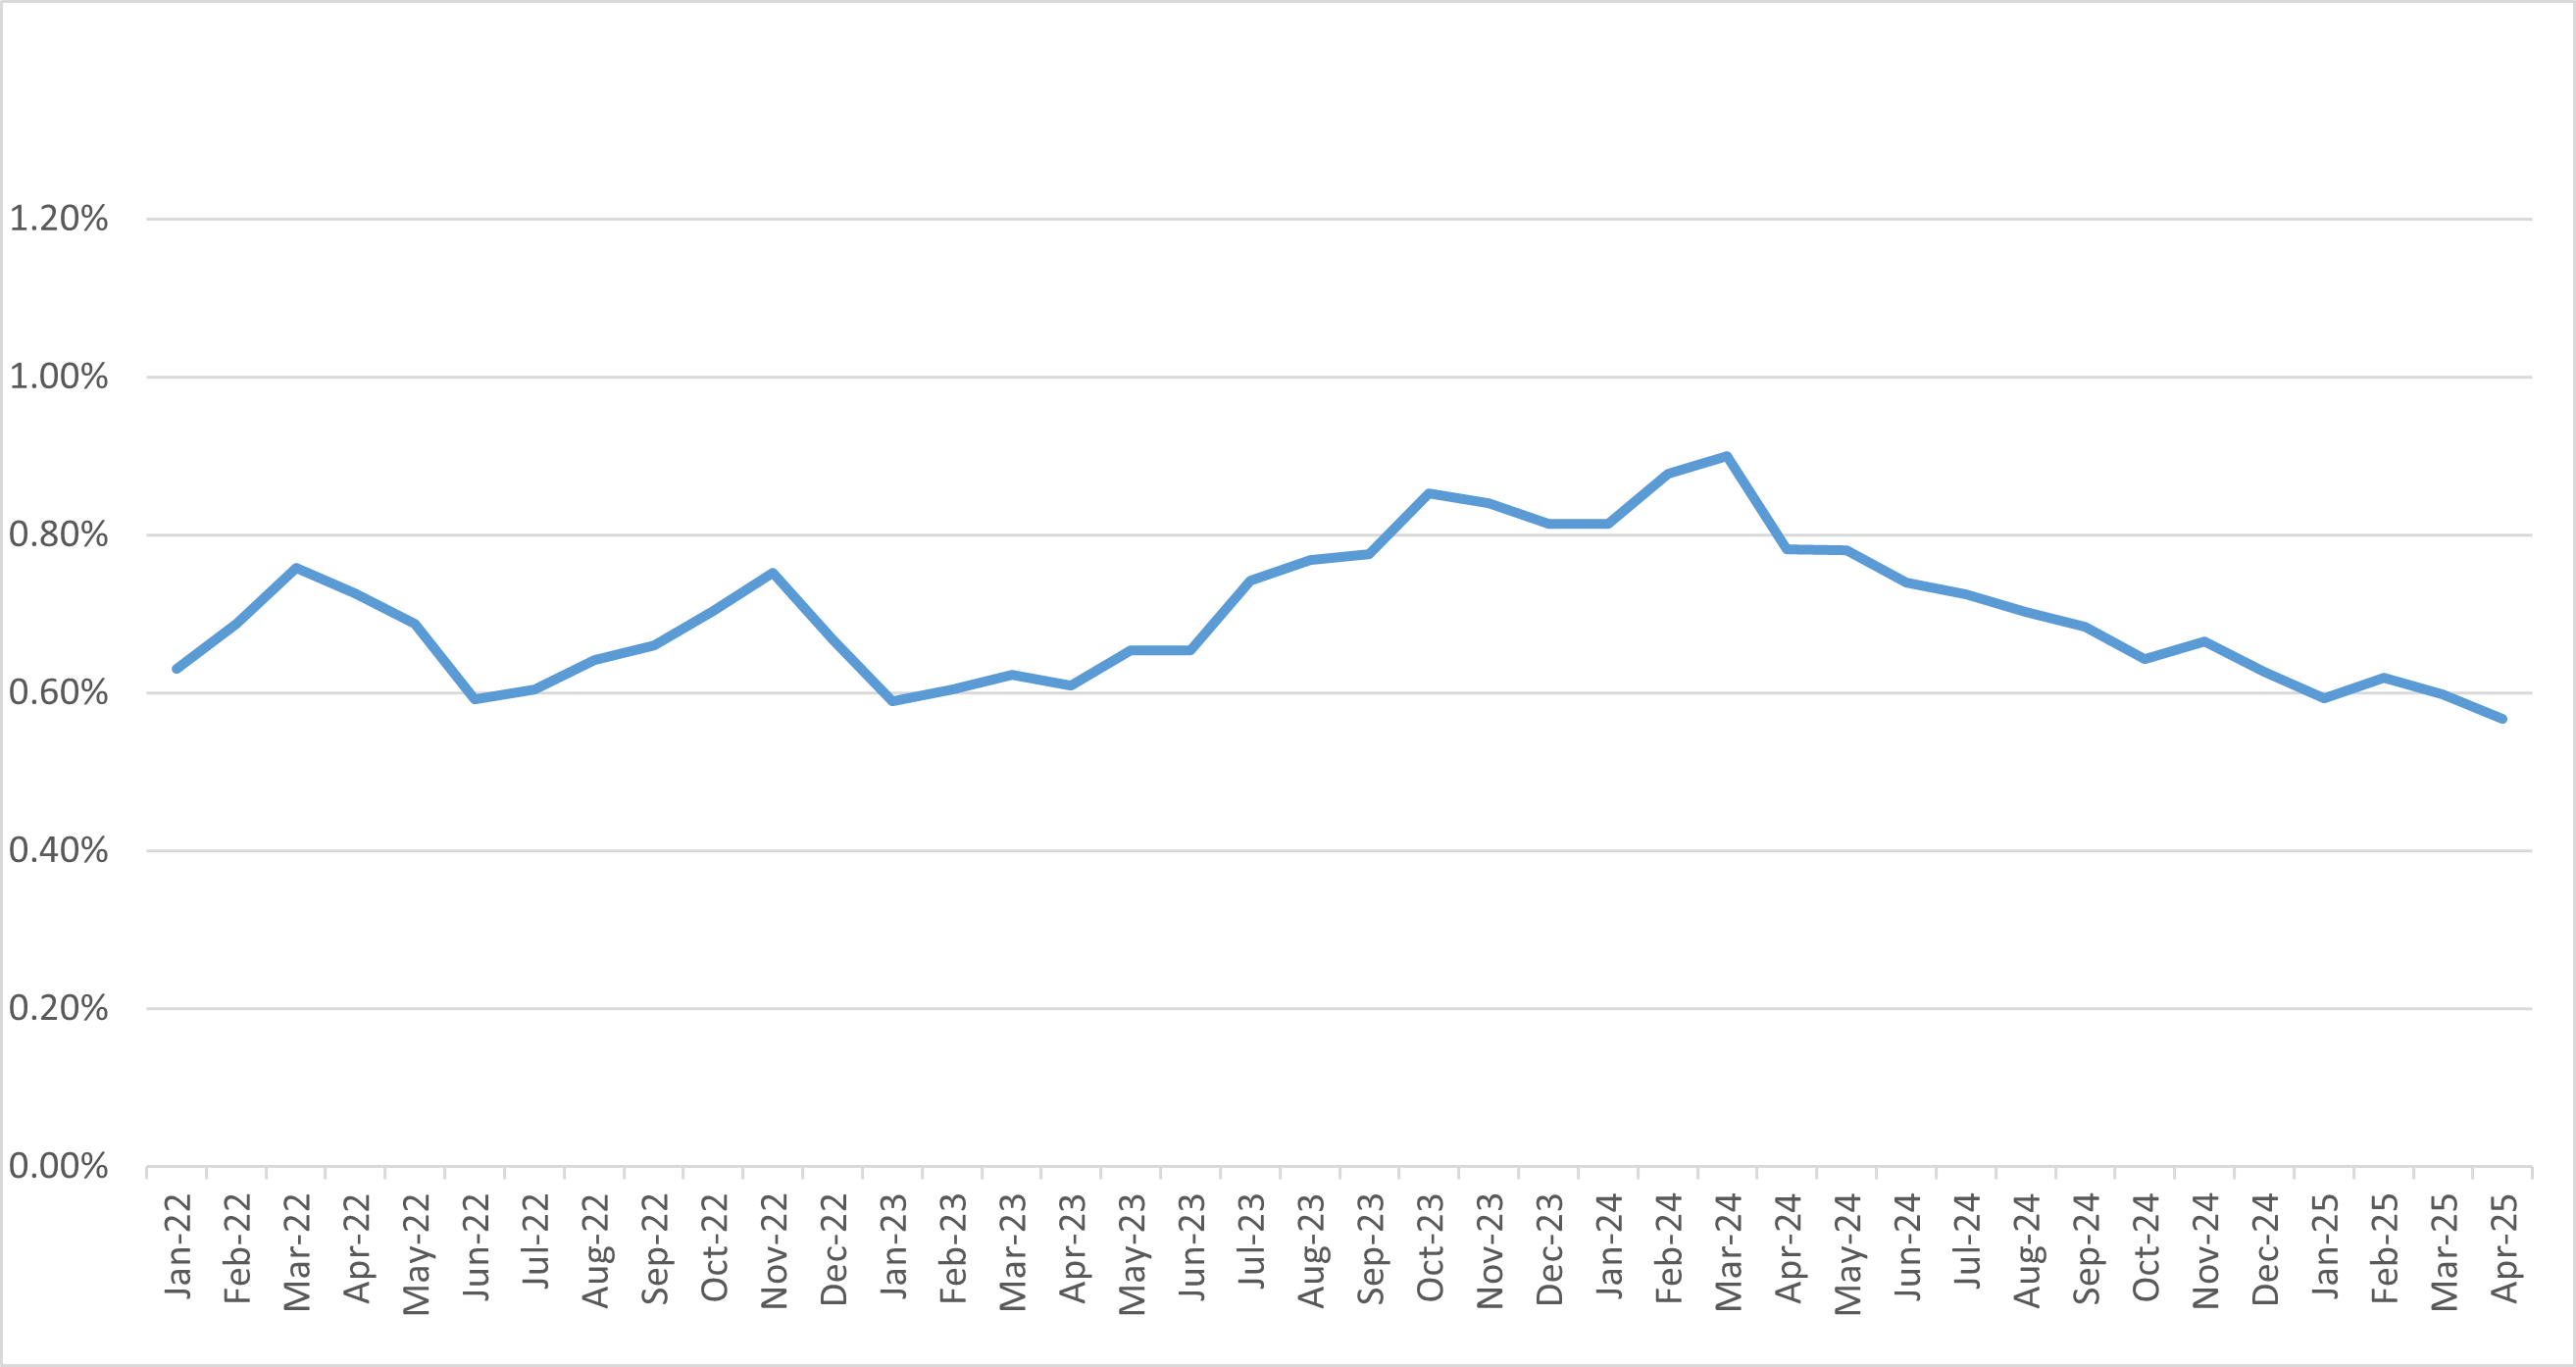
1. Loans facilitated under ICP are excluded from the chart.
