Coastal Financial Corporation Announces First Quarter 2025 Results
Coastal Financial reported Q1 2025 net income of $9.7 million ($0.63 per diluted share), compared to $13.4 million in Q4 2024 and $6.8 million in Q1 2024. The company's Banking as a Service (BaaS) segment CCBX showed strong growth with program fee income increasing 55.2% year-over-year.
Key highlights include:
- Total deposits grew by $205.9 million to $3.79 billion
- BaaS program fee income reached $6.3 million, up 13% from previous quarter
- Credit card portfolio expanded to 237,024 cards, adding 54,575 new cards
- Sold $744.6 million in loans during Q1
Expenses increased 6.8% to $72 million due to investments in technology, compliance, and new partner onboarding. The company maintains 98.8% credit risk indemnification with CCBX partners and expects elevated onboarding activity to continue into Q2 2025 with a robust pipeline of new partnerships.
Coastal Financial ha riportato un utile netto di 9,7 milioni di dollari nel primo trimestre 2025 (0,63 dollari per azione diluita), rispetto ai 13,4 milioni del quarto trimestre 2024 e ai 6,8 milioni del primo trimestre 2024. Il segmento Banking as a Service (BaaS) della società, CCBX, ha mostrato una forte crescita con un aumento del 55,2% su base annua dei ricavi da commissioni di programma.
Punti salienti principali:
- I depositi totali sono cresciuti di 205,9 milioni di dollari raggiungendo 3,79 miliardi
- I ricavi da commissioni del programma BaaS hanno raggiunto 6,3 milioni di dollari, in aumento del 13% rispetto al trimestre precedente
- Il portafoglio carte di credito è cresciuto fino a 237.024 carte, con un incremento di 54.575 nuove carte
- Nel primo trimestre sono stati venduti prestiti per 744,6 milioni di dollari
Le spese sono aumentate del 6,8% a 72 milioni di dollari a causa di investimenti in tecnologia, conformità e onboarding di nuovi partner. L'azienda mantiene un'indennità di rischio credito del 98,8% con i partner CCBX e prevede che l'attività di onboarding elevata continuerà nel secondo trimestre 2025 grazie a un solido portafoglio di nuove collaborazioni.
Coastal Financial reportó un ingreso neto de 9,7 millones de dólares en el primer trimestre de 2025 (0,63 dólares por acción diluida), en comparación con 13,4 millones en el cuarto trimestre de 2024 y 6,8 millones en el primer trimestre de 2024. El segmento Banking as a Service (BaaS) de la compañía, CCBX, mostró un fuerte crecimiento con un aumento del 55,2% interanual en los ingresos por tarifas de programa.
Puntos destacados clave:
- Los depósitos totales crecieron 205,9 millones hasta 3,79 mil millones
- Los ingresos por tarifas del programa BaaS alcanzaron 6,3 millones, un aumento del 13% respecto al trimestre anterior
- La cartera de tarjetas de crédito se expandió a 237.024 tarjetas, sumando 54.575 nuevas tarjetas
- Se vendieron préstamos por 744,6 millones durante el primer trimestre
Los gastos aumentaron un 6,8% a 72 millones debido a inversiones en tecnología, cumplimiento y la incorporación de nuevos socios. La compañía mantiene una indemnización por riesgo crediticio del 98,8% con los socios de CCBX y espera que la elevada actividad de incorporación continúe en el segundo trimestre de 2025 con una sólida cartera de nuevas asociaciones.
Coastal Financial은 2025�� 1분기 순이익으�� 970�� 달러(희석 주당 0.63달러)�� 보고했으��, 이는 2024�� 4분기�� 1,340�� 달러와 2024�� 1분기�� 680�� 달러와 비교됩니��. 회사�� Banking as a Service (BaaS) 부문인 CCBX�� 프로그램 수수�� 수익�� 전년 대�� 55.2% 증가하며 강한 성장�� 보였습니��.
주요 내용은 다음�� 같습니다:
- �� 예금�� 2�� 590�� 달러 증가하여 37�� 9천만 달러�� 도달
- BaaS 프로그램 수수�� 수익은 630�� 달러�� 전분�� 대�� 13% 증가
- 신용카드 포트폴리오가 237,024장으�� 확대되어 54,575장의 신규 카드 추가
- 1분기 동안 7�� 4,460�� 달러�� 대�� 판매
기술, 준�� �� 신규 파트�� 온보딩에 대�� 투자�� 인해 비용�� 6.8% 증가하여 7,200�� 달러�� 달했습니��. 회사�� CCBX 파트너와 98.8%�� 신용 위험 면책�� 유지하고 있으��, 강력�� 신규 파트너십 파이프라인과 함께 2025�� 2분기에도 높은 온보�� 활동�� 계속�� 것으�� 예상합니��.
Coastal Financial a annoncé un bénéfice net de 9,7 millions de dollars au premier trimestre 2025 (0,63 dollar par action diluée), contre 13,4 millions au quatrième trimestre 2024 et 6,8 millions au premier trimestre 2024. Le segment Banking as a Service (BaaS) de l'entreprise, CCBX, a connu une forte croissance avec une augmentation de 55,2 % des revenus de frais de programme en glissement annuel.
Points clés :
- Les dépôts totaux ont augmenté de 205,9 millions pour atteindre 3,79 milliards
- Les revenus des frais du programme BaaS ont atteint 6,3 millions, en hausse de 13 % par rapport au trimestre précédent
- Le portefeuille de cartes de crédit s'est étendu à 237 024 cartes, avec 54 575 nouvelles cartes ajoutées
- 744,6 millions de prêts ont été vendus au cours du premier trimestre
Les dépenses ont augmenté de 6,8 % pour atteindre 72 millions en raison d'investissements dans la technologie, la conformité et l'intégration de nouveaux partenaires. L'entreprise maintient une indemnisation du risque de crédit de 98,8 % avec les partenaires CCBX et prévoit que l'activité d'intégration élevée se poursuivra au deuxième trimestre 2025 avec un solide pipeline de nouveaux partenariats.
Coastal Financial meldete für das erste Quartal 2025 einen Nettogewinn von 9,7 Millionen US-Dollar (0,63 US-Dollar je verwässerter Aktie), im Vergleich zu 13,4 Millionen im vierten Quartal 2024 und 6,8 Millionen im ersten Quartal 2024. Das Banking as a Service (BaaS)-Segment CCBX des Unternehmens verzeichnete ein starkes Wachstum mit einem Anstieg der Programmgebührenerlöse um 55,2 % im Jahresvergleich.
Wichtige Highlights:
- Die Gesamteinlagen stiegen um 205,9 Millionen auf 3,79 Milliarden US-Dollar
- Die Einnahmen aus BaaS-Programmgebühren erreichten 6,3 Millionen US-Dollar, ein Anstieg von 13 % gegenüber dem Vorquartal
- Das Kreditkartenportfolio wuchs auf 237.024 Karten und wurde um 54.575 neue Karten erweitert
- Im ersten Quartal wurden Kredite im Wert von 744,6 Millionen US-Dollar verkauft
Die Ausgaben stiegen aufgrund von Investitionen in Technologie, Compliance und die Integration neuer Partner um 6,8 % auf 72 Millionen US-Dollar. Das Unternehmen hält eine Kreditrisikoentschädigung von 98,8 % bei CCBX-Partnern aufrecht und erwartet, dass die hohe Onboarding-Aktivität mit einer robusten Pipeline neuer Partnerschaften bis ins zweite Quartal 2025 anhält.
- CCBX program fee income increased 55.2% compared to Q1 2024, reaching $6.3M
- Strong deposit growth of $205.9M (+5.7%) in Q1 2025
- Credit card portfolio expanded by 54,575 cards in Q1, with 237,024 total fee-earning cards
- 98.8% credit risk indemnification maintained with CCBX partners
- Net income of $9.7M in Q1 2025, up from $6.8M in Q1 2024
- Robust CCBX pipeline with two partners in testing and three in implementation
- Q1 2025 net income decreased to $9.7M from $13.4M in Q4 2024
- Elevated expenses due to new partner onboarding and technology investments
- Higher legal and professional fees expected to continue through Q2 2025
- Noninterest expense increased 6.8% to $72.0M compared to Q4 2024
- ROA declined to 0.93% from 1.30% in previous quarter
- Efficiency ratio deteriorated to 51.59% from 46.02% in Q4 2024
Insights
Coastal Financial's Q1 results show mixed signals: quarterly profit down 27.5% while investing heavily in growth initiatives and technology.
Coastal Financial Corporation (NASDAQ: CCB) delivered Q1 2025 results with
The quarterly profit decline stems from elevated expenses related to onboarding new Banking-as-a-Service (BaaS) partnerships and technology investments. Noninterest expenses increased
Despite the earnings decline, several positive metrics emerged. Total deposits grew by
The company's efficiency ratio deteriorated to
The credit card business shows strong momentum with 237,024 cards (up 54,575 from Q4), and the company maintains robust risk management with
EVERETT, Wash., April 29, 2025 (GLOBE NEWSWIRE) -- Coastal Financial Corporation (Nasdaq: CCB) (the “Company��, "Coastal", "we", "our", or "us"), the holding company for Coastal Community Bank (the “Bank��), through which it operates a community-focused bank segment ("community bank") with an industry leading banking as a service ("BaaS") segment ("CCBX"), today reported unaudited financial results for the quarter ended March��31, 2025, including net income of
Management Discussion of the First Quarter Results
“First quarter of 2025 was impacted by elevated expenses related to the onboarding and implementation costs of several new partnerships and products within CCBX and investments in technology, however, we anticipate that the revenue and earnings from these investments will be highly valuable over the long-term,�� stated CEO Eric Sprink. “We saw high quality deposit growth of
Key Points for First Quarter and Our Go-Forward Strategy
- Positive Growth Trends within CCBX Continue. As of March��31, 2025 we had two partners in testing, three in implementation/onboarding, one signed LOI and have an active pipeline of new partners and new products with existing partners for the balance of 2025 and into 2026. Total BaaS program fee income was
$6.3 million for the three months ended March��31, 2025, an increase of$724,000 , or13.0% , from the three months ended December��31, 2024. We remain fully indemnified against fraud and98.8% indemnified against credit risk with our CCBX partners as of March��31, 2025.
- Investments for Growth Continues. Total noninterest expense of
$72.0 million was up$4.6 million , or6.8% , as compared to$67.4 million in the quarter ended December��31, 2024, mainly driven by higher salaries and employee benefits, legal and professional expenses and BaaS loan expense partially offset by lower BaaS fraud expense. As we increase the number of new CCBX partners and products with existing partners launching in 2025, we expect that expenses will tend to be front-loaded with a focus on compliance and operational risk before any new programs or products generate significant revenues. We remain focused on building our future revenue sources.
- Strong Deposit Growth, Off Balance Sheet Activity Update. Total deposits of
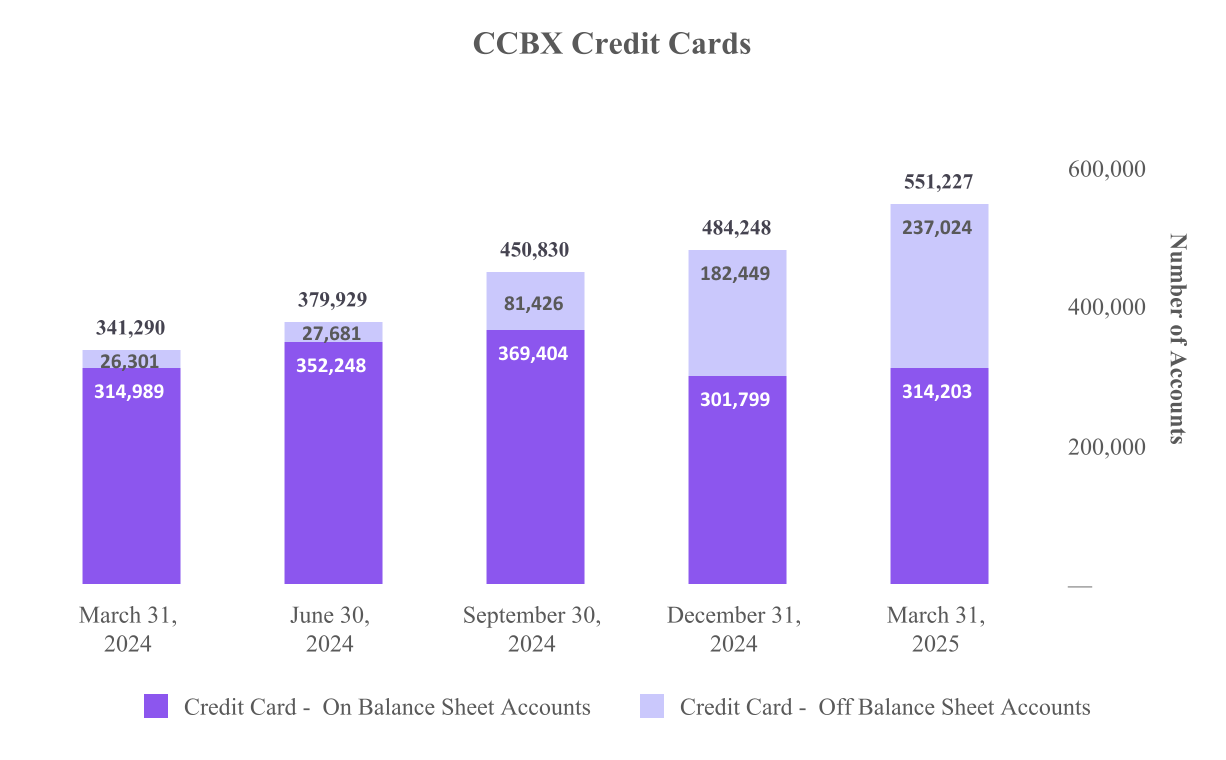
$3.79 billion , an increase of$205.9 million , or5.7% , over the quarter ended December��31, 2024, driven primarily by growth in CCBX partner programs. On April 1, 2025 we launched the T-Mobile deposit program and those deposits will be reflected in the second quarter deposit totals. During the first quarter of 2025, we sold$744.6 million of loans, the majority of which were credit card receivables. We retain a portion of the fee income on sold credit card loans. As of March��31, 2025 there were 237,024 credit cards with fee earning potential, an increase of 54,575 compared to the quarter ended December��31, 2024 and an increase of 210,723 from March��31, 2024.
First Quarter 2025 Financial Highlights
The tables below outline some of our key operating metrics.
| �� | Three Months Ended | ||||||||||||||||||
| (Dollars in thousands, except share and per share data; unaudited) | March 31, 2025 | �� | December 31, 2024 | �� | September 30, 2024 | �� | June 30, 2024 | �� | March 31, 2024 | ||||||||||
| Income Statement Data: | �� | �� | �� | �� | �� | �� | �� | �� | �� | ||||||||||
| Interest and dividend income | $ | 104,907 | �� | �� | $ | 102,448 | �� | �� | $ | 105,165 | �� | �� | $ | 97,422 | �� | �� | $ | 91,742 | �� |
| Interest expense | �� | 28,845 | �� | �� | �� | 30,071 | �� | �� | �� | 32,892 | �� | �� | �� | 31,250 | �� | �� | �� | 29,536 | �� |
| Net interest income | �� | 76,062 | �� | �� | �� | 72,377 | �� | �� | �� | 72,273 | �� | �� | �� | 66,172 | �� | �� | �� | 62,206 | �� |
| Provision for credit losses | �� | 55,781 | �� | �� | �� | 61,867 | �� | �� | �� | 70,257 | �� | �� | �� | 62,325 | �� | �� | �� | 83,158 | �� |
| Net interest (expense)/ income after��provision for credit losses | �� | 20,281 | �� | �� | �� | 10,510 | �� | �� | �� | 2,016 | �� | �� | �� | 3,847 | �� | �� | �� | (20,952 | ) |
| Noninterest income | �� | 63,477 | �� | �� | �� | 74,100 | �� | �� | �� | 78,790 | �� | �� | �� | 69,138 | �� | �� | �� | 86,176 | �� |
| Noninterest expense | �� | 71,989 | �� | �� | �� | 67,411 | �� | �� | �� | 64,424 | �� | �� | �� | 57,964 | �� | �� | �� | 56,509 | �� |
| Provision for income tax | �� | 2,039 | �� | �� | �� | 3,832 | �� | �� | �� | 2,926 | �� | �� | �� | 3,425 | �� | �� | �� | 1,915 | �� |
| Net income | �� | 9,730 | �� | �� | �� | 13,367 | �� | �� | �� | 13,456 | �� | �� | �� | 11,596 | �� | �� | �� | 6,800 | �� |
| �� | �� | �� | �� | �� | �� | �� | �� | �� | �� | ||||||||||
| �� | As of and for the Three Month Period | ||||||||||||||||||
| �� | March 31, 2025 | �� | December 31, 2024 | �� | September 30, 2024 | �� | June 30, 2024 | �� | March 31, 2024 | ||||||||||
| Balance Sheet Data: | �� | �� | �� | �� | �� | �� | �� | �� | �� | ||||||||||
| Cash and cash equivalents | $ | 624,302 | �� | �� | $ | 452,513 | �� | �� | $ | 484,026 | �� | �� | $ | 487,245 | �� | �� | $ | 515,128 | �� |
| Investment securities | �� | 46,991 | �� | �� | �� | 47,321 | �� | �� | �� | 48,620 | �� | �� | �� | 49,213 | �� | �� | �� | 50,090 | �� |
| Loans held for sale | �� | 42,132 | �� | �� | �� | 20,600 | �� | �� | �� | 7,565 | �� | �� | �� | �� | �� | �� | �� | 797 | �� |
| Loans receivable | �� | 3,517,359 | �� | �� | �� | 3,486,565 | �� | �� | �� | 3,413,894 | �� | �� | �� | 3,321,813 | �� | �� | �� | 3,195,101 | �� |
| Allowance for credit losses | �� | (183,178 | ) | �� | �� | (176,994 | ) | �� | �� | (171,674 | ) | �� | �� | (148,878 | ) | �� | �� | (139,941 | ) |
| Total assets | �� | 4,339,282 | �� | �� | �� | 4,121,208 | �� | �� | �� | 4,064,472 | �� | �� | �� | 3,959,549 | �� | �� | �� | 3,863,062 | �� |
| Interest bearing deposits | �� | 3,251,599 | �� | �� | �� | 3,057,808 | �� | �� | �� | 3,047,861 | �� | �� | �� | 2,949,643 | �� | �� | �� | 2,888,867 | �� |
| Noninterest bearing deposits | �� | 539,630 | �� | �� | �� | 527,524 | �� | �� | �� | 579,427 | �� | �� | �� | 593,789 | �� | �� | �� | 574,112 | �� |
| Core deposits (1) | �� | 3,321,772 | �� | �� | �� | 3,123,434 | �� | �� | �� | 3,190,869 | �� | �� | �� | 3,528,339 | �� | �� | �� | 3,447,864 | �� |
| Total deposits | �� | 3,791,229 | �� | �� | �� | 3,585,332 | �� | �� | �� | 3,627,288 | �� | �� | �� | 3,543,432 | �� | �� | �� | 3,462,979 | �� |
| Total borrowings | �� | 47,923 | �� | �� | �� | 47,884 | �� | �� | �� | 47,847 | �� | �� | �� | 47,810 | �� | �� | �� | 47,771 | �� |
| Total shareholders�� equity | �� | 449,917 | �� | �� | �� | 438,704 | �� | �� | �� | 331,930 | �� | �� | �� | 316,693 | �� | �� | �� | 303,709 | �� |
| �� | �� | �� | �� | �� | �� | �� | �� | �� | �� | ||||||||||
| Share and Per Share Data (2): | �� | �� | �� | �� | �� | �� | �� | �� | �� | ||||||||||
| Earnings per share �� basic | $ | 0.65 | �� | �� | $ | 0.97 | �� | �� | $ | 1.00 | �� | �� | $ | 0.86 | �� | �� | $ | 0.51 | �� |
| Earnings per share �� diluted | $ | 0.63 | �� | �� | $ | 0.94 | �� | �� | $ | 0.97 | �� | �� | $ | 0.84 | �� | �� | $ | 0.50 | �� |
| Dividends per share | �� | �� | �� | �� | �� | �� | �� | �� | �� | �� | �� | �� | �� | �� | �� | �� | �� | �� | �� |
| Book value per share (3) | $ | 29.98 | �� | �� | $ | 29.37 | �� | �� | $ | 24.51 | �� | �� | $ | 23.54 | �� | �� | $ | 22.65 | �� |
| Tangible book value per share (4) | $ | 29.98 | �� | �� | $ | 29.37 | �� | �� | $ | 24.51 | �� | �� | $ | 23.54 | �� | �� | $ | 22.65 | �� |
| Weighted avg outstanding shares �� basic | �� | 14,962,507 | �� | �� | �� | 13,828,605 | �� | �� | �� | 13,447,066 | �� | �� | �� | 13,412,667 | �� | �� | �� | 13,340,997 | �� |
| Weighted avg outstanding shares �� diluted | �� | 15,462,041 | �� | �� | �� | 14,268,229 | �� | �� | �� | 13,822,270 | �� | �� | �� | 13,736,508 | �� | �� | �� | 13,676,917 | �� |
| Shares outstanding at end of period | �� | 15,009,225 | �� | �� | �� | 14,935,298 | �� | �� | �� | 13,543,282 | �� | �� | �� | 13,453,805 | �� | �� | �� | 13,407,320 | �� |
| Stock options outstanding at end of period | �� | 163,932 | �� | �� | �� | 186,354 | �� | �� | �� | 198,370 | �� | �� | �� | 286,119 | �� | �� | �� | 309,069 | �� |
See footnotes that follow the tables below
| �� | As of and for the Three Month Period | ||||||||||||||||||
| �� | March 31, 2025 | �� | December 31, 2024 | �� | September 30, 2024 | �� | June 30, 2024 | �� | March 31, 2024 | ||||||||||
| Credit Quality Data: | �� | �� | �� | �� | �� | �� | �� | �� | �� | ||||||||||
| Nonperforming assets (5) to total assets | �� | 1.30 | % | �� | �� | 1.52 | % | �� | �� | 1.63 | % | �� | �� | 1.34 | % | �� | �� | 1.42 | % |
| Nonperforming assets (5) to loans receivable and OREO | �� | 1.60 | % | �� | �� | 1.80 | % | �� | �� | 1.94 | % | �� | �� | 1.60 | % | �� | �� | 1.72 | % |
| Nonperforming loans (5) to total loans receivable | �� | 1.60 | % | �� | �� | 1.80 | % | �� | �� | 1.94 | % | �� | �� | 1.60 | % | �� | �� | 1.72 | % |
| Allowance for credit losses to nonperforming loans | �� | 325.0 | % | �� | �� | 282.5 | % | �� | �� | 257.2 | % | �� | �� | 278.6 | % | �� | �� | 254.3 | % |
| Allowance for credit losses to total loans receivable | �� | 5.21 | % | �� | �� | 5.08 | % | �� | �� | 5.03 | % | �� | �� | 4.45 | % | �� | �� | 4.35 | % |
| Gross charge-offs | $ | 53,686 | �� | �� | $ | 61,585 | �� | �� | $ | 53,305 | �� | �� | $ | 55,207 | �� | �� | $ | 58,994 | �� |
| Gross recoveries | $ | 5,486 | �� | �� | $ | 5,223 | �� | �� | $ | 4,516 | �� | �� | $ | 2,254 | �� | �� | $ | 2,036 | �� |
| Net charge-offs to average loans (6) | �� | 5.57 | % | �� | �� | 6.56 | % | �� | �� | 5.60 | % | �� | �� | 6.54 | % | �� | �� | 7.30 | % |
| �� | �� | �� | �� | �� | �� | �� | �� | �� | �� | ||||||||||
| Capital Ratios: | �� | �� | �� | �� | �� | �� | �� | �� | �� | ||||||||||
| Company | �� | �� | �� | �� | �� | �� | �� | �� | �� | ||||||||||
| Tier 1 leverage capital | �� | 10.67 | % | �� | �� | 10.78 | % | �� | �� | 8.40 | % | �� | �� | 8.31 | % | �� | �� | 8.24 | % |
| Common equity Tier 1 risk-based capital | �� | 12.13 | % | �� | �� | 12.04 | % | �� | �� | 9.24 | % | �� | �� | 9.03 | % | �� | �� | 8.98 | % |
| Tier 1 risk-based capital | �� | 12.22 | % | �� | �� | 12.14 | % | �� | �� | 9.34 | % | �� | �� | 9.13 | % | �� | �� | 9.08 | % |
| Total risk-based capital | �� | 14.73 | % | �� | �� | 14.67 | % | �� | �� | 11.89 | % | �� | �� | 11.70 | % | �� | �� | 11.70 | % |
| Bank | �� | �� | �� | �� | �� | �� | �� | �� | �� | ||||||||||
| Tier 1 leverage capital | �� | 10.57 | % | �� | �� | 10.64 | % | �� | �� | 9.29 | % | �� | �� | 9.24 | % | �� | �� | 9.19 | % |
| Common equity Tier 1 risk-based capital | �� | 12.12 | % | �� | �� | 11.99 | % | �� | �� | 10.34 | % | �� | �� | 10.15 | % | �� | �� | 10.14 | % |
| Tier 1 risk-based capital | �� | 12.12 | % | �� | �� | 11.99 | % | �� | �� | 10.34 | % | �� | �� | 10.15 | % | �� | �� | 10.14 | % |
| Total risk-based capital | �� | 13.42 | % | �� | �� | 13.28 | % | �� | �� | 11.63 | % | �� | �� | 11.44 | % | �� | �� | 11.43 | % |
| (1) | ��Core deposits are defined as all deposits excluding brokered and time deposits. |
| (2) | Share and per share amounts are based on total actual or average common shares outstanding, as applicable. |
| (3) | We calculate book value per share as total shareholders�� equity at the end of the relevant period divided by the outstanding number of our common shares at the end of each period. |
| (4) | Tangible book value per share is a non-GAAP financial measure. We calculate tangible book value per share as total shareholders�� equity at the end of the relevant period, less goodwill and other intangible assets, divided by the outstanding number of our common shares at the end of each period. The most directly comparable GAAP financial measure is book value per share. We had no goodwill or other intangible assets as of any of the dates indicated. As a result, tangible book value per share is the same as book value per share as of each of the dates indicated. |
| (5) | Nonperforming assets and nonperforming loans include loans 90+ days past due and accruing interest. |
| (6) | Annualized calculations. |
| �� | �� |
Key Performance Ratios
Return on average assets ("ROA") was
Legal and professional fees in first quarter were elevated in multiple areas including compliance, BSA, audit, legal and projects as we prepare for new partners, and we may experience a similar level of expenses again in second quarter before returning to a more historical level in third quarter 2025.
Yield on earning assets and yield on loans receivable increased
The following table shows the Company’s key performance ratios for the periods indicated.����
| �� | �� | Three Months Ended | ||||||||||||||||||
| (unaudited) | �� | March 31, 2025 | �� | December 31, 2024 | �� | September 30, 2024 | �� | June 30, 2024 | �� | March 31, 2024 | ||||||||||
| �� | �� | �� | �� | �� | �� | �� | �� | �� | �� | �� | ||||||||||
| Return on average assets (1) | �� | �� | 0.93 | % | �� | �� | 1.30 | % | �� | �� | 1.34 | % | �� | �� | 1.21 | % | �� | �� | 0.73 | % |
| Return on average equity (1) | �� | �� | 8.91 | % | �� | �� | 14.90 | % | �� | �� | 16.67 | % | �� | �� | 15.22 | % | �� | �� | 9.21 | % |
| Yield on earnings assets (1) | �� | �� | 10.32 | % | �� | �� | 10.24 | % | �� | �� | 10.79 | % | �� | �� | 10.49 | % | �� | �� | 10.21 | % |
| Yield on loans receivable (1) | �� | �� | 11.33 | % | �� | �� | 11.12 | % | �� | �� | 11.44 | % | �� | �� | 11.22 | % | �� | �� | 11.01 | % |
| Cost of funds (1) | �� | �� | 3.11 | % | �� | �� | 3.24 | % | �� | �� | 3.62 | % | �� | �� | 3.60 | % | �� | �� | 3.52 | % |
| Cost of deposits (1) | �� | �� | 3.08 | % | �� | �� | 3.21 | % | �� | �� | 3.59 | % | �� | �� | 3.58 | % | �� | �� | 3.49 | % |
| Net interest margin (1) | �� | �� | 7.48 | % | �� | �� | 7.23 | % | �� | �� | 7.42 | % | �� | �� | 7.12 | % | �� | �� | 6.92 | % |
| Noninterest expense to average assets (1) | �� | �� | 6.87 | % | �� | �� | 6.54 | % | �� | �� | 6.42 | % | �� | �� | 6.05 | % | �� | �� | 6.10 | % |
| Noninterest income to average assets (1) | �� | �� | 6.06 | % | �� | �� | 7.19 | % | �� | �� | 7.85 | % | �� | �� | 7.22 | % | �� | �� | 9.30 | % |
| Efficiency ratio | �� | �� | 51.59 | % | �� | �� | 46.02 | % | �� | �� | 42.65 | % | �� | �� | 42.84 | % | �� | �� | 38.08 | % |
| Loans receivable to deposits (2) | �� | �� | 93.89 | % | �� | �� | 97.82 | % | �� | �� | 94.33 | % | �� | �� | 93.75 | % | �� | �� | 92.29 | % |
| (1) | ����Annualized calculations shown for quarterly periods presented. |
| (2) | ����Includes loans held for sale. |
| �� | �� |
Management Outlook; CEO Eric Sprink
“Looking ahead to the balance of 2025, elevated onboarding activity is expected to continue into the second quarter as our CCBX pipeline remains very robust with high quality and potentially impactful opportunities. We plan to continue to invest in and enhance our technology and risk management infrastructure to support our next phase of CCBX growth. Our risk reduction efforts, namely our fraud and credit indemnifications via our partners, continued to function as expected despite the volatile macroeconomics conditions towards the end of first quarter. These efforts, plus additional growth in noninterest income should help mitigate the uncertainties associated with fluctuating interest rates and provide a stable, recurring income source.�� said CEO Eric Sprink.
Coastal Financial Corporation Overview
The Company has one main subsidiary, the Bank, which consists of three segments: CCBX, the community bank and treasury & administration.����The CCBX segment includes all of our BaaS activities, the community bank segment includes all community banking activities and the treasury & administration segment includes treasury management, overall administration and all other aspects of the Company.����
CCBX Performance Update
Our CCBX segment continues to evolve, and we have 25 relationships, at varying stages, including two partners in testing, three in implementation/onboarding, one signed LOI as of March��31, 2025.�� We continue to refine the criteria for CCBX partnerships, exploring relationships with larger more established partners, with experienced management teams, existing customer bases and strong financial positions. We also will consider promising medium and smaller sized partners that align with our approach and terms including financial wherewithal and will continue to exit relationships where it makes sense for us to do so.
While we explore relationships with new partners we continue to expand our product offerings with existing CCBX partners. As we become more proficient in the BaaS space we aim to cultivate new relationships that align with our long-term goals. We believe that a strategy of adding new partnerships and launching new products with existing partners allows us to expand and grow our customer base with a modest increase in regulatory risk given our operational history with them. Increases in partner activity/transaction counts is positively impacting noninterest income and we expect this trend to continue as current products grow and new products are introduced . We plan to continue selling loans as part of our strategy to balance partner and lending limits, and manage the loan portfolio and credit quality. We retain a portion of the fee income for our role in processing transactions on sold credit card balances, and will continue this strategy to provide an on-going and passive revenue source with no on balance sheet risk or capital requirement.
On April 1, 2025, we went live with the T-Mobile deposit program and our second quarter deposits will include those balances. As we build our deposit base, we will be able to sweep deposits off and on the balance sheet as needed. This deposit sweep capability allows us to better manage liquidity and deposit programs. At March 31, 2025 we swept off
The following table illustrates the activity and evolution in CCBX relationships for the periods presented.
| �� | As of | ||||
| (unaudited) | March 31, 2025 | �� | December 31, 2024 | �� | March 31, 2024 |
| Active | 19 | �� | 19 | �� | 19 |
| Friends and family / testing | 2 | �� | 1 | �� | 1 |
| Implementation / onboarding | 3 | �� | 1 | �� | 1 |
| Signed letters of intent | 1 | �� | 3 | �� | 0 |
| Total CCBX relationships | 25 | �� | 24 | �� | 21 |
| �� | �� | �� | �� | �� | �� |
CCBX loans increased
The following table details the CCBX loan portfolio:
| CCBX | �� | As of | ||||||||||||||||||||||
| �� | �� | March 31, 2025 | �� | December 31, 2024 | �� | March 31, 2024 | ||||||||||||||||||
| (dollars in thousands; unaudited) | �� | Balance | �� | % to Total | �� | Balance | �� | % to Total | �� | Balance | �� | % to Total | ||||||||||||
| Commercial and industrial loans: | �� | �� | �� | �� | �� | �� | �� | �� | �� | �� | �� | �� | ||||||||||||
| Capital call lines | �� | $ | 133,466 | �� | �� | �� | 8.1 | % | �� | $ | 109,017 | �� | �� | �� | 6.8 | % | �� | $ | 135,671 | �� | �� | �� | 10.3 | % |
| All other commercial & industrial loans | �� | �� | 29,702 | �� | �� | �� | 1.8 | �� | �� | �� | 33,961 | �� | �� | �� | 2.1 | �� | �� | �� | 47,160 | �� | �� | �� | 3.6 | �� |
| AG���˹ٷ� estate loans: | �� | �� | �� | �� | �� | �� | �� | �� | �� | �� | �� | �� | ||||||||||||
| Residential real estate loans | �� | �� | 285,355 | �� | �� | �� | 17.3 | �� | �� | �� | 267,707 | �� | �� | �� | 16.7 | �� | �� | �� | 265,148 | �� | �� | �� | 20.2 | �� |
| Consumer and other loans: | �� | �� | �� | �� | �� | �� | �� | �� | �� | �� | �� | �� | ||||||||||||
| Credit cards | �� | �� | 532,775 | �� | �� | �� | 32.2 | �� | �� | �� | 528,554 | �� | �� | �� | 33.0 | �� | �� | �� | 505,706 | �� | �� | �� | 38.6 | �� |
| Other consumer and other loans | �� | �� | 670,026 | �� | �� | �� | 40.6 | �� | �� | �� | 664,780 | �� | �� | �� | 41.4 | �� | �� | �� | 358,528 | �� | �� | �� | 27.3 | �� |
| Gross CCBX loans receivable | �� | �� | 1,651,324 | �� | �� | �� | 100.0 | % | �� | �� | 1,604,019 | �� | �� | �� | 100.0 | % | �� | �� | 1,312,213 | �� | �� | �� | 100.0 | % |
| Net deferred origination (fees) costs | �� | �� | (498 | ) | �� | �� | �� | �� | (442 | ) | �� | �� | �� | �� | (394 | ) | �� | �� | ||||||
| Loans receivable | �� | $ | 1,650,826 | �� | �� | �� | �� | $ | 1,603,577 | �� | �� | �� | �� | $ | 1,311,819 | �� | �� | �� | ||||||
| Loan Yield - CCBX (1)(2) | �� | �� | 16.88 | % | �� | �� | �� | �� | 16.81 | % | �� | �� | �� | �� | 17.74 | % | �� | �� | ||||||
| �� | �� | �� | �� | �� | �� | �� | �� | �� | �� | �� | �� | �� | ||||||||||||
| (1) | CCBX yield does not include the impact of BaaS loan expense.����BaaS loan expense represents the amount paid or payable to partners for credit enhancements and originating & servicing CCBX loans. See reconciliation of the non-GAAP measures at the end of this earnings release for the impact of BaaS loan expense on CCBX loan yield. |
| (2) | Loan yield is annualized for the three months ended for each period presented and includes loans held for sale and nonaccrual loans. |
| �� | �� |
The increase in CCBX loans in the quarter ended March��31, 2025, includes an increase of
The following chart shows the growth in credit card accounts that generate fee income. This includes accounts with balances, which are included in our loan totals, and accounts that have been sold and have no corresponding balance in our loan totals, and that generate fee income.
The following table details the CCBX deposit portfolio:
| CCBX | �� | As of | ||||||||||||||||||||||
| �� | �� | March 31, 2025 | �� | December 31, 2024 | �� | March 31, 2024 | ||||||||||||||||||
| (dollars in thousands; unaudited) | �� | Balance | �� | % to Total | �� | Balance | �� | % to Total | �� | Balance | �� | % to Total | ||||||||||||
| Demand, noninterest bearing | �� | $ | 58,416 | �� | �� | �� | 2.6 | % | �� | $ | 55,686 | �� | �� | �� | 2.7 | % | �� | $ | 58,669 | �� | �� | �� | 2.9 | % |
| Interest bearing demand and��money market | �� | �� | 2,145,608 | �� | �� | �� | 94.6 | �� | �� | �� | 1,958,459 | �� | �� | �� | 94.9 | �� | �� | �� | 1,964,942 | �� | �� | �� | 96.8 | �� |
| Savings | �� | �� | 16,625 | �� | �� | �� | 0.7 | �� | �� | �� | 5,710 | �� | �� | �� | 0.3 | �� | �� | �� | 5,338 | �� | �� | �� | 0.3 | �� |
| Total core deposits | �� | �� | 2,220,649 | �� | �� | �� | 97.9 | �� | �� | �� | 2,019,855 | �� | �� | �� | 97.9 | �� | �� | �� | 2,028,949 | �� | �� | �� | 100.0 | �� |
| Other deposits | �� | �� | 46,359 | �� | �� | �� | 2.1 | �� | �� | �� | 44,233 | �� | �� | �� | 2.1 | �� | �� | �� | �� | �� | �� | �� | �� | �� |
| Total CCBX deposits | �� | $ | 2,267,008 | �� | �� | �� | 100.0 | % | �� | $ | 2,064,088 | �� | �� | �� | 100.0 | % | �� | $ | 2,028,949 | �� | �� | �� | 100.0 | % |
| Cost of deposits (1) | �� | �� | 4.01 | % | �� | �� | �� | �� | 4.19 | % | �� | �� | �� | �� | 4.93 | % | �� | �� | ||||||
| (1) | Cost of deposits is annualized for the three months ended for each period presented. |
| �� | �� |
CCBX deposits increased
Community Bank Performance Update
In the quarter ended March��31, 2025, the community bank saw net loans decrease
The following table details the Community Bank loan portfolio:
| Community Bank | �� | As of | ||||||||||||||||||||||
| �� | �� | March 31, 2025 | �� | December 31, 2024 | �� | March 31, 2024 | ||||||||||||||||||
| (dollars in thousands; unaudited) | �� | Balance | �� | % to Total | �� | Balance | �� | % to Total | �� | Balance | �� | % to Total | ||||||||||||
| Commercial and industrial loans | �� | $ | 149,104 | �� | �� | �� | 8.0 | % | �� | $ | 150,395 | �� | �� | �� | 8.0 | % | �� | $ | 154,395 | �� | �� | �� | 8.2 | % |
| AG���˹ٷ� estate loans: | �� | �� | �� | �� | �� | �� | �� | �� | �� | �� | �� | �� | ||||||||||||
| Construction, land and land development loans | �� | �� | 166,551 | �� | �� | �� | 8.9 | �� | �� | �� | 148,198 | �� | �� | �� | 7.8 | �� | �� | �� | 160,862 | �� | �� | �� | 8.5 | �� |
| Residential real estate loans | �� | �� | 202,920 | �� | �� | �� | 10.8 | �� | �� | �� | 202,064 | �� | �� | �� | 10.7 | �� | �� | �� | 231,157 | �� | �� | �� | 12.2 | �� |
| Commercial real estate loans | �� | �� | 1,340,647 | �� | �� | �� | 71.6 | �� | �� | �� | 1,374,801 | �� | �� | �� | 72.8 | �� | �� | �� | 1,342,489 | �� | �� | �� | 71.0 | �� |
| Consumer and other loans: | �� | �� | �� | �� | �� | �� | �� | �� | �� | �� | �� | �� | ||||||||||||
| Other consumer and other loans | �� | �� | 13,326 | �� | �� | �� | 0.7 | �� | �� | �� | 13,542 | �� | �� | �� | 0.7 | �� | �� | �� | 1,447 | �� | �� | �� | 0.1 | �� |
| Gross Community Bank loans receivable | �� | �� | 1,872,548 | �� | �� | �� | 100.0 | % | �� | �� | 1,889,000 | �� | �� | �� | 100.0 | % | �� | �� | 1,890,350 | �� | �� | �� | 100.0 | % |
| Net deferred origination fees | �� | �� | (6,015 | ) | �� | �� | �� | �� | (6,012 | ) | �� | �� | �� | �� | (7,068 | ) | �� | �� | ||||||
| Loans receivable | �� | $ | 1,866,533 | �� | �� | �� | �� | $ | 1,882,988 | �� | �� | �� | �� | $ | 1,883,282 | �� | �� | �� | ||||||
| Loan Yield(1) | �� | �� | 6.53 | % | �� | �� | �� | �� | 6.53 | % | �� | �� | �� | �� | 6.46 | % | �� | �� | ||||||
| (1) | Loan yield is annualized for the three months ended for each period presented and includes loans held for sale and nonaccrual loans. |
| �� | �� |
Community bank loans decreased
The following table details the community bank deposit portfolio:
| Community Bank | �� | As of | ||||||||||||||||||||||
| �� | �� | March 31, 2025 | �� | December 31, 2024 | �� | March 31, 2024 | ||||||||||||||||||
| (dollars in thousands; unaudited) | �� | Balance | �� | % to Total | �� | Balance | �� | % to Total | �� | Balance | �� | % to Total | ||||||||||||
| Demand, noninterest bearing | �� | $ | 481,214 | �� | �� | �� | 31.5 | % | �� | $ | 471,838 | �� | �� | �� | 31.0 | % | �� | $ | 515,443 | �� | �� | �� | 35.9 | % |
| Interest bearing demand and��money market | �� | �� | 560,416 | �� | �� | �� | 36.8 | �� | �� | �� | 570,625 | �� | �� | �� | 37.5 | �� | �� | �� | 834,725 | �� | �� | �� | 58.2 | �� |
| Savings | �� | �� | 59,493 | �� | �� | �� | 3.9 | �� | �� | �� | 61,116 | �� | �� | �� | 4.0 | �� | �� | �� | 68,747 | �� | �� | �� | 4.8 | �� |
| Total core deposits | �� | �� | 1,101,123 | �� | �� | �� | 72.2 | �� | �� | �� | 1,103,579 | �� | �� | �� | 72.5 | �� | �� | �� | 1,418,915 | �� | �� | �� | 99.0 | �� |
| Other deposits | �� | �� | 407,391 | �� | �� | �� | 26.7 | �� | �� | �� | 400,118 | �� | �� | �� | 26.3 | �� | �� | �� | 1 | �� | �� | �� | 0.0 | �� |
| Time deposits less than | �� | �� | 5,585 | �� | �� | �� | 0.4 | �� | �� | �� | 5,920 | �� | �� | �� | 0.4 | �� | �� | �� | 7,199 | �� | �� | �� | 0.5 | �� |
| Time deposits | �� | �� | 10,122 | �� | �� | �� | 0.7 | �� | �� | �� | 11,627 | �� | �� | �� | 0.8 | �� | �� | �� | 7,915 | �� | �� | �� | 0.6 | �� |
| Total Community Bank deposits | �� | $ | 1,524,221 | �� | �� | �� | 100.0 | % | �� | $ | 1,521,244 | �� | �� | �� | 100.0 | % | �� | $ | 1,434,030 | �� | �� | �� | 100.0 | % |
| Cost of deposits(1) | �� | �� | 1.76 | % | �� | �� | �� | �� | 1.86 | % | �� | �� | �� | �� | 1.66 | % | �� | �� | ||||||
| (1)���� | Cost of deposits is annualized for the three months ended for each period presented. |
| �� | �� |
Community bank deposits increased
Net Interest Income and Margin Discussion
Net interest income was
Net interest margin was
The following tables illustrate how net interest margin and loan yield is affected by BaaS loan expense:
| Consolidated | �� | As of and for the Three Months Ended | ||||||||||
| (dollars in thousands; unaudited) | �� | March 31 2025 | �� | December 31 2024 | �� | March 31 2024 | ||||||
| Net interest margin, net of BaaS loan expense: | �� | �� | �� | �� | ||||||||
| Net interest margin (1) | �� | �� | 7.48 | % | �� | �� | 7.23 | % | �� | �� | 6.92 | % |
| Earning assets | �� | �� | 4,124,065 | �� | �� | �� | 3,980,078 | �� | �� | �� | 3,613,769 | �� |
| Net interest income (GAAP) | �� | �� | 76,062 | �� | �� | �� | 72,377 | �� | �� | �� | 62,206 | �� |
| Less: BaaS loan expense | �� | �� | (32,507 | ) | �� | �� | (30,720 | ) | �� | �� | (26,107 | ) |
| Net interest income, net of BaaS loan expense(2) | �� | $ | 43,555 | �� | �� | $ | 41,657 | �� | �� | $ | 36,099 | �� |
| Net interest margin, net of BaaS loan expense (1)(2) | �� | �� | 4.28 | % | �� | �� | 4.16 | % | �� | �� | 4.02 | % |
| Loan income net of BaaS loan expense divided by average loans: | �� | �� | ||||||||||
| Loan yield (GAAP)(1) | �� | �� | 11.33 | % | �� | �� | 11.12 | % | �� | �� | 11.01 | % |
| Total average loans receivable | �� | $ | 3,511,724 | �� | �� | $ | 3,419,476 | �� | �� | $ | 3,137,271 | �� |
| Interest and earned fee income on loans (GAAP) | �� | �� | 98,147 | �� | �� | �� | 95,575 | �� | �� | �� | 85,891 | �� |
| BaaS loan expense | �� | �� | (32,507 | ) | �� | �� | (30,720 | ) | �� | �� | (26,107 | ) |
| Net loan income(2) | �� | $ | 65,640 | �� | �� | $ | 64,855 | �� | �� | $ | 59,784 | �� |
| Loan income, net of BaaS loan expense, divided by average loans (1)(2) | �� | �� | 7.58 | % | �� | �� | 7.55 | % | �� | �� | 7.66 | % |
| (1) | Annualized calculations shown for periods presented. |
| (2) | A reconciliation of the non-GAAP measures are set forth at the end of this earnings release. |
| �� | �� |
Average investment securities decreased
Cost of funds was
The following table summarizes the average yield on loans receivable and cost of deposits:
| �� | For the Three Months Ended | ||||||||||||||||||||||
| �� | March 31, 2025 | �� | December 31, 2024 | �� | March 31, 2024 | ||||||||||||||||||
| �� | Yield on Loans (2) | �� | Cost of Deposits (2) | �� | Yield on Loans (2) | �� | Cost of Deposits (2) | �� | Yield on Loans (2) | �� | Cost of Deposits (2) | ||||||||||||
| Community Bank | �� | 6.53 | % | �� | �� | 1.76 | % | �� | �� | 6.53 | % | �� | �� | 1.86 | % | �� | �� | 6.46 | % | �� | �� | 1.66 | % |
| CCBX (1) | �� | 16.88 | % | �� | �� | 4.01 | % | �� | �� | 16.81 | % | �� | �� | 4.19 | % | �� | �� | 17.74 | % | �� | �� | 4.93 | % |
| Consolidated | �� | 11.33 | % | �� | �� | 3.08 | % | �� | �� | 11.12 | % | �� | �� | 3.21 | % | �� | �� | 11.01 | % | �� | �� | 3.49 | % |
| (1) | CCBX yield on loans does not include the impact of BaaS loan expense.����BaaS loan expense represents the amount paid or payable to partners for credit and fraud enhancements and originating & servicing CCBX loans. To determine Net BaaS loan��income earned from CCBX loan relationships, the Company takes BaaS loan interest income and deducts BaaS loan expense to arrive at Net BaaS loan income which can be compared to interest income on the Company’s community bank loans. See reconciliation of the non-GAAP measures at the end of this earnings release for the impact of BaaS loan expense on CCBX loan yield. |
| (2) | Annualized calculations for periods presented. |
| �� | �� |
The following table illustrates how BaaS loan interest income is affected by BaaS loan expense resulting in net BaaS loan income and the associated yield:
| �� | �� | For the Three Months Ended | ||||||||||||||||||||||
| �� | �� | March 31, 2025 | �� | December 31, 2024 | �� | March 31, 2024 | ||||||||||||||||||
| (dollars in thousands, unaudited) | �� | Income / Expense | �� | Income / expense divided by average CCBX loans (2) | �� | Income / Expense | �� | Income / expense divided by average CCBX loans(2) | �� | Income / Expense | �� | Income / expense divided by average CCBX loans (2) | ||||||||||||
| BaaS loan interest income | �� | $ | 67,855 | �� | �� | �� | 16.88 | % | �� | $ | 64,532 | �� | �� | �� | 16.81 | % | �� | $ | 55,839 | �� | �� | �� | 17.74 | % |
| Less: BaaS loan expense | �� | �� | 32,507 | �� | �� | �� | 8.09 | % | �� | �� | 30,720 | �� | �� | �� | 8.00 | % | �� | �� | 26,107 | �� | �� | �� | 8.29 | % |
| Net BaaS loan income (1) | �� | $ | 35,348 | �� | �� | �� | 8.79 | % | �� | $ | 33,812 | �� | �� | �� | 8.81 | % | �� | $ | 29,732 | �� | �� | �� | 9.45 | % |
| Average BaaS Loans(3) | �� | $ | 1,630,088 | �� | �� | �� | �� | $ | 1,527,178 | �� | �� | �� | �� | $ | 1,265,857 | �� | �� | �� | ||||||
| (1) | A reconciliation of the non-GAAP measures are set forth at the end of this earnings release. |
| (2) | Annualized calculations shown for the periods presented. |
| (3) | Includes loans held for sale. |
| �� | �� |
Noninterest Income Discussion
Noninterest income was
The
Noninterest Expense Discussion
Total noninterest expense increased
The increase in noninterest expenses for the quarter ended March��31, 2025 compared to the quarter ended March��31, 2024 was largely due to a
Certain noninterest expenses are reimbursed by our CCBX partners. In accordance with GAAP we recognize all expenses in noninterest expense and the reimbursement of expenses from our CCBX partner in noninterest income. The following table reflects the portion of noninterest expenses that are reimbursed by partners to assist the understanding of how the increases in noninterest expense are related to expenses incurred for and reimbursed by CCBX partners:
| �� | Three Months Ended | ||||||||||
| �� | March 31, | �� | December 31, | �� | March 31, | ||||||
| (dollars in thousands; unaudited) | �� | 2025 | �� | �� | �� | 2024 | �� | �� | �� | 2024 | �� |
| Total noninterest expense (GAAP) | $ | 71,989 | �� | �� | $ | 67,411 | �� | �� | $ | 56,509 | �� |
| Less: BaaS loan expense | �� | 32,507 | �� | �� | �� | 30,720 | �� | �� | �� | 26,107 | �� |
| Less: BaaS fraud expense | �� | 1,993 | �� | �� | �� | 5,043 | �� | �� | �� | 923 | �� |
| Less: Reimbursement of expenses (BaaS) | �� | 1,026 | �� | �� | �� | 812 | �� | �� | �� | 254 | �� |
| Noninterest expense, net of BaaS loan expense, BaaS fraud expense and reimbursement of expenses (BaaS) (1) | $ | 36,463 | �� | �� | $ | 30,836 | �� | �� | $ | 29,225 | �� |
| (1) | A reconciliation of the non-GAAP measures are set forth at the end of this earnings release. |
| �� | �� |
Provision for Income Taxes
The provision for income taxes was
The Company is subject to various state taxes that are assessed as CCBX activities and employees expand into other states, which has increased the overall tax rate used in calculating the provision for income taxes in the current and future periods. The Company uses a federal statutory tax rate of
Financial Condition Overview
Total assets increased
As of March��31, 2025, in addition to the
The Company, on a stand alone basis, had a cash balance of
Uninsured deposits were
Total shareholders�� equity as of March��31, 2025 increased
The Company and the Bank remained well capitalized at March��31, 2025, as summarized in the following table.
| (unaudited) | �� | Coastal Community Bank | �� | Coastal Financial Corporation | �� | Minimum Well Capitalized Ratios under Prompt Corrective Action (1) | ||||||
| Tier 1 Leverage Capital (to average assets) | �� | �� | 10.57 | % | �� | �� | 10.67 | % | �� | �� | 5.00 | % |
| Common Equity Tier 1 Capital (to risk-weighted assets) | �� | �� | 12.12 | % | �� | �� | 12.13 | % | �� | �� | 6.50 | % |
| Tier 1 Capital (to risk-weighted assets) | �� | �� | 12.12 | % | �� | �� | 12.22 | % | �� | �� | 8.00 | % |
| Total Capital (to risk-weighted assets) | �� | �� | 13.42 | % | �� | �� | 14.73 | % | �� | �� | 10.00 | % |
| (1) | Presents the minimum capital ratios for an insured depository institution, such as the Bank, to be considered well capitalized under the Prompt Corrective Action framework. The minimum requirements for the Company to be considered well capitalized under Regulation Y include to maintain, on a consolidated basis, a total risk-based capital ratio of 10.0 percent or greater and a tier 1 risk-based capital ratio of 6.0 percent or greater. |
| �� | �� |
Asset Quality
The total allowance for credit losses was
The following table details the allocation of the allowance for credit loss as of the period indicated:
| �� | �� | As of March 31, 2025 | �� | As of December 31, 2024 | �� | As of March 31, 2024 | ||||||||||||||||||||||||||||||
| (dollars in thousands; unaudited) | �� | Community Bank | �� | CCBX | �� | Total | �� | Community Bank | �� | CCBX | �� | Total | �� | Community Bank | �� | CCBX | �� | Total | ||||||||||||||||||
| Loans receivable | �� | $ | 1,866,533 | �� | �� | $ | 1,650,826 | �� | �� | $ | 3,517,359 | �� | �� | $ | 1,882,988 | �� | �� | $ | 1,603,577 | �� | �� | $ | 3,486,565 | �� | �� | $ | 1,883,282 | �� | �� | $ | 1,311,819 | �� | �� | $ | 3,195,101 | �� |
| Allowance for credit losses | �� | �� | (18,992 | ) | �� | �� | (164,186 | ) | �� | �� | (183,178 | ) | �� | �� | (18,924 | ) | �� | �� | (158,070 | ) | �� | �� | (176,994 | ) | �� | �� | (21,384 | ) | �� | �� | (118,557 | ) | �� | �� | (139,941 | ) |
| Allowance for credit losses to total loans receivable | �� | �� | 1.02 | % | �� | �� | 9.95 | % | �� | �� | 5.21 | % | �� | �� | 1.00 | % | �� | �� | 9.86 | % | �� | �� | 5.08 | % | �� | �� | 1.14 | % | �� | �� | 9.04 | % | �� | �� | 4.38 | % |
| �� | �� | �� | �� | �� | �� | �� | �� | �� | �� | �� | �� | �� | �� | �� | �� | �� | �� | �� | �� | �� | �� | �� | �� | �� | �� | �� | �� | �� | �� | �� | �� | �� | �� | �� | �� | �� |
Net charge-offs totaled
The following table details net charge-offs for the community bank and CCBX for the period indicated:
| �� | �� | Three Months Ended | ||||||||||||||||||||||||||||||||||
| �� | �� | March 31, 2025 | �� | December 31, 2024 | �� | March 31, 2024 | ||||||||||||||||||||||||||||||
| (dollars in thousands; unaudited) | �� | Community Bank | �� | CCBX | �� | Total | �� | Community Bank | �� | CCBX | �� | Total | �� | Community Bank | �� | CCBX | �� | Total | ||||||||||||||||||
| Gross charge-offs | �� | $ | 4 | �� | �� | $ | 53,682 | �� | �� | $ | 53,686 | �� | �� | $ | 139 | �� | �� | $ | 61,446 | �� | �� | $ | 61,585 | �� | �� | $ | 15 | �� | �� | $ | 58,979 | �� | �� | $ | 58,994 | �� |
| Gross recoveries | �� | �� | (7 | ) | �� | �� | (5,479 | ) | �� | �� | (5,486 | ) | �� | �� | (3 | ) | �� | �� | (5,220 | ) | �� | �� | (5,223 | ) | �� | �� | (4 | ) | �� | �� | (2,032 | ) | �� | �� | (2,036 | ) |
| Net charge-offs | �� | $ | (3 | ) | �� | $ | 48,203 | �� | �� | $ | 48,200 | �� | �� | $ | 136 | �� | �� | $ | 56,226 | �� | �� | $ | 56,362 | �� | �� | $ | 11 | �� | �� | $ | 56,947 | �� | �� | $ | 56,958 | �� |
| Net charge-offs to average loans (1) | �� | �� | 0.00 | % | �� | �� | 11.99 | % | �� | �� | 5.57 | % | �� | �� | 0.03 | % | �� | �� | 14.65 | % | �� | �� | 6.56 | % | �� | �� | 0.00 | % | �� | �� | 18.09 | % | �� | �� | 7.30 | % |
| (1)�� | Annualized calculations shown for periods presented. |
| �� | �� |
During the quarter ended March��31, 2025, a
In accordance with accounting guidance, we estimate and record a provision for expected losses for these CCBX loans and reclassified negative deposit accounts. When the provision for CCBX credit losses and provision for unfunded commitments is recorded, a credit enhancement asset is also recorded on the balance sheet through noninterest income (BaaS credit enhancements). Expected losses are recorded in the allowance for credit losses. The credit enhancement asset is relieved when credit enhancement recoveries are received from the CCBX partner. If our partner is unable to fulfill their contracted obligations then the Bank could be exposed to additional credit losses. Management regularly evaluates and manages this counterparty risk.
The factors used in management’s analysis for community bank credit losses indicated that a provision of
The following table details the provision expense/(recapture) for the community bank and CCBX for the period indicated:
| �� | �� | Three Months Ended | ||||||||||
| (dollars in thousands; unaudited) | �� | March 31, 2025 | �� | December 31, 2024 | �� | March 31, 2024 | ||||||
| Community bank | �� | $ | 65 | �� | �� | $ | (1,071 | ) | �� | $ | (199 | ) |
| CCBX | �� | �� | 54,319 | �� | �� | �� | 63,741 | �� | �� | �� | 79,717 | �� |
| Total provision expense | �� | $ | 54,384 | �� | �� | $ | 62,670 | �� | �� | $ | 79,518 | �� |
| �� | �� | �� | �� | �� | �� | �� | �� | �� | �� | �� | �� | �� |
A provision for unfunded commitments of
At March��31, 2025, our nonperforming assets were
Nonperforming assets decreased
For the quarter ended March��31, 2025, there were
The following table details the Company’s nonperforming assets for the periods indicated.
| Consolidated | As of | ||||||||||
| (dollars in thousands; unaudited) | March 31, 2025 | �� | December 31, 2024 | �� | March 31, 2024 | ||||||
| Nonaccrual loans: | �� | �� | �� | �� | �� | ||||||
| Commercial and industrial loans | $ | 381 | �� | �� | $ | 334 | �� | �� | $ | �� | �� |
| AG���˹ٷ� estate loans: | �� | �� | �� | �� | �� | ||||||
| Residential real estate | �� | �� | �� | �� | �� | �� | �� | �� | �� | 212 | �� |
| Commercial real estate | �� | �� | �� | �� | �� | �� | �� | �� | �� | 7,731 | �� |
| Consumer and other loans: | �� | �� | �� | �� | �� | ||||||
| Credit cards | �� | 13,602 | �� | �� | �� | 10,262 | �� | �� | �� | �� | �� |
| Other consumer and other loans | �� | 6,376 | �� | �� | �� | 8,967 | �� | �� | �� | �� | �� |
| Total nonaccrual loans | �� | 20,359 | �� | �� | �� | 19,563 | �� | �� | �� | 7,943 | �� |
| Accruing loans past due 90 days or more: | �� | �� | �� | �� | �� | ||||||
| Commercial & industrial loans | �� | 782 | �� | �� | �� | 1,006 | �� | �� | �� | 1,793 | �� |
| AG���˹ٷ� estate loans: | �� | �� | �� | �� | �� | ||||||
| Residential real estate loans | �� | 2,407 | �� | �� | �� | 2,608 | �� | �� | �� | 1,796 | �� |
| Consumer and other loans: | �� | �� | �� | �� | �� | ||||||
| Credit cards | �� | 27,187 | �� | �� | �� | 34,490 | �� | �� | �� | 37,603 | �� |
| Other consumer and other loans | �� | 5,632 | �� | �� | �� | 4,989 | �� | �� | �� | 5,731 | �� |
| Total accruing loans past due 90 days or more | �� | 36,008 | �� | �� | �� | 43,093 | �� | �� | �� | 46,923 | �� |
| Total nonperforming loans | �� | 56,367 | �� | �� | �� | 62,656 | �� | �� | �� | 54,866 | �� |
| AG���˹ٷ� estate owned | �� | �� | �� | �� | �� | �� | �� | �� | �� | �� | �� |
| Repossessed assets | �� | �� | �� | �� | �� | �� | �� | �� | �� | �� | �� |
| Total nonperforming assets | $ | 56,367 | �� | �� | $ | 62,656 | �� | �� | $ | 54,866 | �� |
| Total nonaccrual loans to loans receivable | �� | 0.58 | % | �� | �� | 0.56 | % | �� | �� | 0.25 | % |
| Total nonperforming loans to loans receivable | �� | 1.60 | % | �� | �� | 1.80 | % | �� | �� | 1.72 | % |
| Total nonperforming assets to total assets | �� | 1.30 | % | �� | �� | 1.52 | % | �� | �� | 1.42 | % |
| �� | �� | �� | �� | �� | �� | �� | �� | �� | �� | �� | �� |
The following tables detail the CCBX and community bank nonperforming assets which are included in the total nonperforming assets table above.
| CCBX | As of | ||||||||||
| (dollars in thousands; unaudited) | March 31, 2025 | �� | December 31, 2024 | �� | March 31, 2024 | ||||||
| Nonaccrual loans: | �� | �� | �� | �� | �� | ||||||
| Commercial and industrial loans: | �� | �� | �� | �� | �� | ||||||
| All other commercial & industrial loans | $ | 192 | �� | �� | $ | 234 | �� | �� | $ | �� | �� |
| Consumer and other loans: | �� | �� | �� | �� | �� | ||||||
| Credit cards | �� | 13,602 | �� | �� | �� | 10,262 | �� | �� | �� | �� | �� |
| Other consumer and other loans | �� | 6,376 | �� | �� | �� | 8,967 | �� | �� | �� | �� | �� |
| Total nonaccrual loans | �� | 20,170 | �� | �� | �� | 19,463 | �� | �� | �� | �� | �� |
| Accruing loans past due 90 days or more: | �� | �� | �� | �� | �� | ||||||
| Commercial & industrial loans | �� | 782 | �� | �� | �� | 1,006 | �� | �� | �� | 1,793 | �� |
| AG���˹ٷ� estate loans: | �� | �� | �� | �� | �� | ||||||
| Residential real estate loans | �� | 2,407 | �� | �� | �� | 2,608 | �� | �� | �� | 1,796 | �� |
| Consumer and other loans: | �� | �� | �� | �� | �� | ||||||
| Credit cards | �� | 27,187 | �� | �� | �� | 34,490 | �� | �� | �� | 37,603 | �� |
| Other consumer and other loans | �� | 5,632 | �� | �� | �� | 4,989 | �� | �� | �� | 5,731 | �� |
| Total accruing loans past due 90 days or more | �� | 36,008 | �� | �� | �� | 43,093 | �� | �� | �� | 46,923 | �� |
| Total nonperforming loans | �� | 56,178 | �� | �� | �� | 62,556 | �� | �� | �� | 46,923 | �� |
| Other real estate owned | �� | �� | �� | �� | �� | �� | �� | �� | �� | �� | �� |
| Repossessed assets | �� | �� | �� | �� | �� | �� | �� | �� | �� | �� | �� |
| Total nonperforming assets | $ | 56,178 | �� | �� | $ | 62,556 | �� | �� | $ | 46,923 | �� |
| Total CCBX nonperforming assets to total consolidated assets | �� | 1.29 | % | �� | �� | 1.52 | % | �� | �� | 1.21 | % |
| �� | �� | �� | �� | �� | �� | �� | �� | �� | �� | �� | �� |
| Community Bank | As of | ||||||||||
| (dollars in thousands; unaudited) | March 31, 2025 | �� | December 31, 2024 | �� | March 31, 2024 | ||||||
| Nonaccrual loans: | �� | �� | �� | �� | �� | ||||||
| Commercial and industrial loans | $ | 189 | �� | �� | $ | 100 | �� | �� | $ | �� | �� |
| AG���˹ٷ� estate: | �� | �� | �� | �� | �� | ||||||
| Residential real estate | �� | �� | �� | �� | �� | �� | �� | �� | �� | 212 | �� |
| Commercial real estate | �� | �� | �� | �� | �� | �� | �� | �� | �� | 7,731 | �� |
| Total nonaccrual loans | �� | 189 | �� | �� | �� | 100 | �� | �� | �� | 7,943 | �� |
| Accruing loans past due 90 days or more: | �� | �� | �� | �� | �� | ||||||
| Total accruing loans past due 90 days or more | �� | �� | �� | �� | �� | �� | �� | �� | �� | �� | �� |
| Total nonperforming loans | �� | 189 | �� | �� | �� | 100 | �� | �� | �� | 7,943 | �� |
| Other real estate owned | �� | �� | �� | �� | �� | �� | �� | �� | �� | �� | �� |
| Repossessed assets | �� | �� | �� | �� | �� | �� | �� | �� | �� | �� | �� |
| Total nonperforming assets | $ | 189 | �� | �� | $ | 100 | �� | �� | $ | 7,943 | �� |
| Total community bank nonperforming assets to total consolidated assets | �� | 0.01 | % | �� | �� | �� | % | �� | �� | 0.21 | % |
| �� | �� | �� | �� | �� | �� | �� | �� | �� | �� | �� | �� |
About Coastal Financial
Coastal Financial Corporation (Nasdaq: CCB) (the “Company��), is an Everett, Washington based bank holding company whose wholly owned subsidiaries are Coastal Community Bank (“Bank��) and Arlington Olympic LLC.����The
CCB-ER
Contact
Eric Sprink, Chief Executive Officer, (425) 357-3659
Joel Edwards, Executive Vice President & Chief Financial Officer, (425) 357-3687
Forward-Looking Statements
This earnings release contains forward-looking statements within the meaning of the Private Securities Litigation Reform Act of 1995. These forward-looking statements reflect our current views with respect to, among other things, future events and our financial performance. Any statements about our management’s expectations, beliefs, plans, predictions, forecasts, objectives, assumptions or future events or performance are not historical facts and may be forward-looking. These statements are often, but not always, made through the use of words or phrases such as “anticipate,�� “believes,�� “can,�� “could,�� “may,�� “predicts,�� “potential,�� “should,�� “will,�� “estimate,�� “plans,�� “projects,�� “continuing,�� “ongoing,�� “expects,�� “intends�� and similar words or phrases. Any or all of the forward-looking statements in this earnings release may turn out to be inaccurate. The inclusion of or reference to forward-looking information in this earnings release should not be regarded as a representation by us or any other person that the future plans, estimates or expectations contemplated by us will be achieved. We have based these forward looking statements largely on our current expectations and projections about future events and financial trends that we believe may affect our financial condition, results of operations, business strategy and financial needs. Our actual results could differ materially from those anticipated in such forward-looking statements as a result of risks, uncertainties and assumptions that are difficult to predict. Factors that could cause actual results to differ materially from those in the forward-looking statements include, without limitation, the risk that changes in U.S. trade policies, including the imposition of tariffs and retaliatory tariffs, may adversely impact our business, financial condition, and results of operations and those other risks and uncertainties discussed under “Risk Factors�� in our Annual Report on Form 10-K for the most recent period filed and in any of our subsequent filings with the Securities and Exchange Commission.
If one or more events related to these or other risks or uncertainties materialize, or if our underlying assumptions prove to be incorrect, actual results may differ materially from what we anticipate. You are cautioned not to place undue reliance on forward-looking statements. Further, any forward-looking statement speaks only as of the date on which it is made, and we undertake no obligation to update or revise any forward-looking statement to reflect events or circumstances after the date on which the statement is made or to reflect the occurrence of unanticipated events, except as required by law.
COASTAL FINANCIAL CORPORATION
CONDENSED CONSOLIDATED STATEMENTS OF FINANCIAL CONDITION
(Dollars in thousands; unaudited)
| ASSETS | |||||||||||||||||||
| �� | March 31, 2025 | �� | December 31, 2024 | �� | September 30, 2024 | �� | June 30, 2024 | �� | March 31, 2024 | ||||||||||
| Cash and due from banks | $ | 43,467 | �� | �� | $ | 36,533 | �� | �� | $ | 45,327 | �� | �� | $ | 59,995 | �� | �� | $ | 32,790 | �� |
| Interest earning deposits with other banks | �� | 580,835 | �� | �� | �� | 415,980 | �� | �� | �� | 438,699 | �� | �� | �� | 427,250 | �� | �� | �� | 482,338 | �� |
| Investment securities, available for sale, at fair value | �� | 34 | �� | �� | �� | 35 | �� | �� | �� | 38 | �� | �� | �� | 39 | �� | �� | �� | 41 | �� |
| Investment securities, held to maturity, at amortized cost | �� | 46,957 | �� | �� | �� | 47,286 | �� | �� | �� | 48,582 | �� | �� | �� | 49,174 | �� | �� | �� | 50,049 | �� |
| Other investments | �� | 12,589 | �� | �� | �� | 10,800 | �� | �� | �� | 10,757 | �� | �� | �� | 10,664 | �� | �� | �� | 10,583 | �� |
| Loans held for sale | �� | 42,132 | �� | �� | �� | 20,600 | �� | �� | �� | 7,565 | �� | �� | �� | �� | �� | �� | �� | 797 | �� |
| Loans receivable | �� | 3,517,359 | �� | �� | �� | 3,486,565 | �� | �� | �� | 3,413,894 | �� | �� | �� | 3,321,813 | �� | �� | �� | 3,195,101 | �� |
| Allowance for credit losses | �� | (183,178 | ) | �� | �� | (176,994 | ) | �� | �� | (171,674 | ) | �� | �� | (148,878 | ) | �� | �� | (139,941 | ) |
| Total loans receivable, net | �� | 3,334,181 | �� | �� | �� | 3,309,571 | �� | �� | �� | 3,242,220 | �� | �� | �� | 3,172,935 | �� | �� | �� | 3,055,160 | �� |
| CCBX credit enhancement asset | �� | 183,377 | �� | �� | �� | 181,890 | �� | �� | �� | 173,600 | �� | �� | �� | 149,096 | �� | �� | �� | 142,412 | �� |
| CCBX receivable | �� | 12,685 | �� | �� | �� | 14,138 | �� | �� | �� | 16,060 | �� | �� | �� | 11,520 | �� | �� | �� | 10,369 | �� |
| Premises and equipment, net | �� | 28,639 | �� | �� | �� | 27,431 | �� | �� | �� | 25,833 | �� | �� | �� | 24,526 | �� | �� | �� | 22,995 | �� |
| Lease right-of-use assets | �� | 5,117 | �� | �� | �� | 5,219 | �� | �� | �� | 5,427 | �� | �� | �� | 5,635 | �� | �� | �� | 5,756 | �� |
| Accrued interest receivable | �� | 21,109 | �� | �� | �� | 21,104 | �� | �� | �� | 22,315 | �� | �� | �� | 21,620 | �� | �� | �� | 22,485 | �� |
| Bank-owned life insurance, net | �� | 13,501 | �� | �� | �� | 13,375 | �� | �� | �� | 13,255 | �� | �� | �� | 13,132 | �� | �� | �� | 12,991 | �� |
| Deferred tax asset, net | �� | 3,912 | �� | �� | �� | 3,600 | �� | �� | �� | 3,083 | �� | �� | �� | 2,221 | �� | �� | �� | 2,221 | �� |
| Other assets | �� | 10,747 | �� | �� | �� | 13,646 | �� | �� | �� | 11,711 | �� | �� | �� | 11,742 | �� | �� | �� | 12,075 | �� |
| Total assets | $ | 4,339,282 | �� | �� | $ | 4,121,208 | �� | �� | $ | 4,064,472 | �� | �� | $ | 3,959,549 | �� | �� | $ | 3,863,062 | �� |
| �� | �� | �� | �� | �� | �� | �� | �� | �� | �� | ||||||||||
| LIABILITIES AND SHAREHOLDERS�� EQUITY | |||||||||||||||||||
| LIABILITIES | �� | �� | �� | �� | �� | �� | �� | �� | �� | ||||||||||
| Deposits | $ | 3,791,229 | �� | �� | $ | 3,585,332 | �� | �� | $ | 3,627,288 | �� | �� | $ | 3,543,432 | �� | �� | $ | 3,462,979 | �� |
| Subordinated debt, net | �� | 44,331 | �� | �� | �� | 44,293 | �� | �� | �� | 44,256 | �� | �� | �� | 44,219 | �� | �� | �� | 44,181 | �� |
| Junior subordinated debentures, net | �� | 3,592 | �� | �� | �� | 3,591 | �� | �� | �� | 3,591 | �� | �� | �� | 3,591 | �� | �� | �� | 3,590 | �� |
| Deferred compensation | �� | 310 | �� | �� | �� | 332 | �� | �� | �� | 369 | �� | �� | �� | 405 | �� | �� | �� | 442 | �� |
| Accrued interest payable | �� | 1,107 | �� | �� | �� | 962 | �� | �� | �� | 1,070 | �� | �� | �� | 999 | �� | �� | �� | 1,061 | �� |
| Lease liabilities | �� | 5,293 | �� | �� | �� | 5,398 | �� | �� | �� | 5,609 | �� | �� | �� | 5,821 | �� | �� | �� | 5,946 | �� |
| CCBX payable | �� | 29,391 | �� | �� | �� | 29,171 | �� | �� | �� | 37,839 | �� | �� | �� | 32,539 | �� | �� | �� | 30,899 | �� |
| Other liabilities | �� | 14,112 | �� | �� | �� | 13,425 | �� | �� | �� | 12,520 | �� | �� | �� | 11,850 | �� | �� | �� | 10,255 | �� |
| Total liabilities | �� | 3,889,365 | �� | �� | �� | 3,682,504 | �� | �� | �� | 3,732,542 | �� | �� | �� | 3,642,856 | �� | �� | �� | 3,559,353 | �� |
| SHAREHOLDERS�� EQUITY | �� | �� | �� | �� | �� | �� | �� | �� | �� | ||||||||||
| Common Stock | �� | 229,659 | �� | �� | �� | 228,177 | �� | �� | �� | 134,769 | �� | �� | �� | 132,989 | �� | �� | �� | 131,601 | �� |
| Retained earnings | �� | 220,259 | �� | �� | �� | 210,529 | �� | �� | �� | 197,162 | �� | �� | �� | 183,706 | �� | �� | �� | 172,110 | �� |
| Accumulated other comprehensive��loss, net of tax | �� | (1 | ) | �� | �� | (2 | ) | �� | �� | (1 | ) | �� | �� | (2 | ) | �� | �� | (2 | ) |
| Total shareholders�� equity | �� | 449,917 | �� | �� | �� | 438,704 | �� | �� | �� | 331,930 | �� | �� | �� | 316,693 | �� | �� | �� | 303,709 | �� |
| Total liabilities and shareholders�� equity | $ | 4,339,282 | �� | �� | $ | 4,121,208 | �� | �� | $ | 4,064,472 | �� | �� | $ | 3,959,549 | �� | �� | $ | 3,863,062 | �� |
| �� | �� | �� | �� | �� | �� | �� | �� | �� | �� | �� | �� | �� | �� | �� | �� | �� | �� | �� | �� |
COASTAL FINANCIAL CORPORATION
CONDENSED CONSOLIDATED STATEMENTS OF INCOME
(Dollars in thousands, except per share amounts; unaudited)
| �� | Three Months Ended | ||||||||||||||||||
| �� | March 31, 2025 | �� | December 31, 2024 | �� | September 30, 2024 | �� | June 30, 2024 | �� | March 31, 2024 | ||||||||||
| INTEREST AND DIVIDEND INCOME | �� | �� | �� | �� | �� | �� | �� | �� | �� | ||||||||||
| Interest and fees on loans | $ | 98,147 | �� | �� | $ | 95,575 | �� | �� | $ | 99,676 | �� | �� | $ | 90,879 | �� | �� | $ | 85,891 | �� |
| Interest on interest earning deposits with��other banks | �� | 6,070 | �� | �� | �� | 6,021 | �� | �� | �� | 4,781 | �� | �� | �� | 5,683 | �� | �� | �� | 4,780 | �� |
| Interest on investment securities | �� | 650 | �� | �� | �� | 661 | �� | �� | �� | 675 | �� | �� | �� | 686 | �� | �� | �� | 1,034 | �� |
| Dividends on other investments | �� | 40 | �� | �� | �� | 191 | �� | �� | �� | 33 | �� | �� | �� | 174 | �� | �� | �� | 37 | �� |
| Total interest income | �� | 104,907 | �� | �� | �� | 102,448 | �� | �� | �� | 105,165 | �� | �� | �� | 97,422 | �� | �� | �� | 91,742 | �� |
| INTEREST EXPENSE | �� | �� | �� | �� | �� | �� | �� | �� | �� | ||||||||||
| Interest on deposits | �� | 28,185 | �� | �� | �� | 29,404 | �� | �� | �� | 32,083 | �� | �� | �� | 30,578 | �� | �� | �� | 28,867 | �� |
| Interest on borrowed funds | �� | 660 | �� | �� | �� | 667 | �� | �� | �� | 809 | �� | �� | �� | 672 | �� | �� | �� | 669 | �� |
| Total interest expense | �� | 28,845 | �� | �� | �� | 30,071 | �� | �� | �� | 32,892 | �� | �� | �� | 31,250 | �� | �� | �� | 29,536 | �� |
| Net interest income | �� | 76,062 | �� | �� | �� | 72,377 | �� | �� | �� | 72,273 | �� | �� | �� | 66,172 | �� | �� | �� | 62,206 | �� |
| PROVISION FOR CREDIT LOSSES | �� | 55,781 | �� | �� | �� | 61,867 | �� | �� | �� | 70,257 | �� | �� | �� | 62,325 | �� | �� | �� | 83,158 | �� |
| Net interest income/(expense) after��provision for credit losses | �� | 20,281 | �� | �� | �� | 10,510 | �� | �� | �� | 2,016 | �� | �� | �� | 3,847 | �� | �� | �� | (20,952 | ) |
| NONINTEREST INCOME | �� | �� | �� | �� | �� | �� | �� | �� | �� | ||||||||||
| Service charges and fees | �� | 860 | �� | �� | �� | 932 | �� | �� | �� | 952 | �� | �� | �� | 946 | �� | �� | �� | 908 | �� |
| Loan referral fees | �� | �� | �� | �� | �� | �� | �� | �� | �� | �� | �� | �� | �� | �� | �� | �� | �� | 168 | �� |
| Unrealized gain (loss) on equity securities,��net | �� | 16 | �� | �� | �� | 1 | �� | �� | �� | 2 | �� | �� | �� | 9 | �� | �� | �� | 15 | �� |
| Other income | �� | 682 | �� | �� | �� | 473 | �� | �� | �� | 486 | �� | �� | �� | 257 | �� | �� | �� | 308 | �� |
| Noninterest income, excluding BaaS program income and BaaS indemnification income | �� | 1,558 | �� | �� | �� | 1,406 | �� | �� | �� | 1,440 | �� | �� | �� | 1,212 | �� | �� | �� | 1,399 | �� |
| Servicing and other BaaS fees | �� | 1,419 | �� | �� | �� | 1,043 | �� | �� | �� | 1,044 | �� | �� | �� | 1,525 | �� | �� | �� | 1,131 | �� |
| Transaction and interchange fees | �� | 3,833 | �� | �� | �� | 3,699 | �� | �� | �� | 3,549 | �� | �� | �� | 2,934 | �� | �� | �� | 2,661 | �� |
| Reimbursement of expenses | �� | 1,026 | �� | �� | �� | 812 | �� | �� | �� | 565 | �� | �� | �� | 857 | �� | �� | �� | 254 | �� |
| BaaS program income | �� | 6,278 | �� | �� | �� | 5,554 | �� | �� | �� | 5,158 | �� | �� | �� | 5,316 | �� | �� | �� | 4,046 | �� |
| BaaS credit enhancements | �� | 53,648 | �� | �� | �� | 62,097 | �� | �� | �� | 70,108 | �� | �� | �� | 60,826 | �� | �� | �� | 79,808 | �� |
| BaaS fraud enhancements | �� | 1,993 | �� | �� | �� | 5,043 | �� | �� | �� | 2,084 | �� | �� | �� | 1,784 | �� | �� | �� | 923 | �� |
| BaaS indemnification income | �� | 55,641 | �� | �� | �� | 67,140 | �� | �� | �� | 72,192 | �� | �� | �� | 62,610 | �� | �� | �� | 80,731 | �� |
| Total noninterest income | �� | 63,477 | �� | �� | �� | 74,100 | �� | �� | �� | 78,790 | �� | �� | �� | 69,138 | �� | �� | �� | 86,176 | �� |
| NONINTEREST EXPENSE | �� | �� | �� | �� | �� | �� | �� | �� | �� | ||||||||||
| Salaries and employee benefits | �� | 21,532 | �� | �� | �� | 17,994 | �� | �� | �� | 17,101 | �� | �� | �� | 17,005 | �� | �� | �� | 17,984 | �� |
| Occupancy | �� | 1,034 | �� | �� | �� | 958 | �� | �� | �� | 964 | �� | �� | �� | 985 | �� | �� | �� | 1,518 | �� |
| Data processing and software licenses | �� | 4,232 | �� | �� | �� | 4,010 | �� | �� | �� | 4,297 | �� | �� | �� | 3,625 | �� | �� | �� | 2,892 | �� |
| Legal and professional expenses | �� | 6,488 | �� | �� | �� | 4,606 | �� | �� | �� | 3,597 | �� | �� | �� | 3,631 | �� | �� | �� | 3,672 | �� |
| Point of sale expense | �� | 107 | �� | �� | �� | 89 | �� | �� | �� | 73 | �� | �� | �� | 72 | �� | �� | �� | 90 | �� |
| Excise taxes | �� | 722 | �� | �� | �� | 778 | �� | �� | �� | 762 | �� | �� | �� | (706 | ) | �� | �� | 320 | �� |
| Federal Deposit Insurance Corporation��("FDIC") assessments | �� | 755 | �� | �� | �� | 750 | �� | �� | �� | 740 | �� | �� | �� | 690 | �� | �� | �� | 683 | �� |
| Director and staff expenses | �� | 631 | �� | �� | �� | 683 | �� | �� | �� | 559 | �� | �� | �� | 470 | �� | �� | �� | 400 | �� |
| Marketing | �� | 50 | �� | �� | �� | 28 | �� | �� | �� | 67 | �� | �� | �� | 14 | �� | �� | �� | 53 | �� |
| Other expense | �� | 1,938 | �� | �� | �� | 1,752 | �� | �� | �� | 1,482 | �� | �� | �� | 1,383 | �� | �� | �� | 1,867 | �� |
| Noninterest expense, excluding BaaS loan and BaaS fraud expense | �� | 37,489 | �� | �� | �� | 31,648 | �� | �� | �� | 29,642 | �� | �� | �� | 27,169 | �� | �� | �� | 29,479 | �� |
| BaaS loan expense | �� | 32,507 | �� | �� | �� | 30,720 | �� | �� | �� | 32,698 | �� | �� | �� | 29,011 | �� | �� | �� | 26,107 | �� |
| BaaS fraud expense | �� | 1,993 | �� | �� | �� | 5,043 | �� | �� | �� | 2,084 | �� | �� | �� | 1,784 | �� | �� | �� | 923 | �� |
| BaaS loan and fraud expense | �� | 34,500 | �� | �� | �� | 35,763 | �� | �� | �� | 34,782 | �� | �� | �� | 30,795 | �� | �� | �� | 27,030 | �� |
| Total noninterest expense | �� | 71,989 | �� | �� | �� | 67,411 | �� | �� | �� | 64,424 | �� | �� | �� | 57,964 | �� | �� | �� | 56,509 | �� |
| Income before provision for income��taxes | �� | 11,769 | �� | �� | �� | 17,199 | �� | �� | �� | 16,382 | �� | �� | �� | 15,021 | �� | �� | �� | 8,715 | �� |
| PROVISION FOR INCOME TAXES | �� | 2,039 | �� | �� | �� | 3,832 | �� | �� | �� | 2,926 | �� | �� | �� | 3,425 | �� | �� | �� | 1,915 | �� |
| NET INCOME | $ | 9,730 | �� | �� | $ | 13,367 | �� | �� | $ | 13,456 | �� | �� | $ | 11,596 | �� | �� | $ | 6,800 | �� |
| Basic earnings per common share | $ | 0.65 | �� | �� | $ | 0.97 | �� | �� | $ | 1.00 | �� | �� | $ | 0.86 | �� | �� | $ | 0.51 | �� |
| Diluted earnings per common share | $ | 0.63 | �� | �� | $ | 0.94 | �� | �� | $ | 0.97 | �� | �� | $ | 0.84 | �� | �� | $ | 0.50 | �� |
| Weighted average number of common shares��outstanding: | �� | �� | �� | �� | �� | �� | �� | �� | �� | ||||||||||
| Basic | �� | 14,962,507 | �� | �� | �� | 13,828,605 | �� | �� | �� | 13,447,066 | �� | �� | �� | 13,412,667 | �� | �� | �� | 13,340,997 | �� |
| Diluted | �� | 15,462,041 | �� | �� | �� | 14,268,229 | �� | �� | �� | 13,822,270 | �� | �� | �� | 13,736,508 | �� | �� | �� | 13,676,917 | �� |
| �� | �� | �� | �� | �� | �� | �� | �� | �� | �� | �� | �� | �� | �� | �� | �� | �� | �� | �� | �� |
COASTAL FINANCIAL CORPORATION
AVERAGE BALANCES, YIELDS, AND RATES �� QUARTERLY
(Dollars in thousands; unaudited)
| �� | For the Three Months Ended | ||||||||||||||||||||||||||||||||||
| �� | March 31, 2025 | �� | December 31, 2024 | �� | March 31, 2024 | ||||||||||||||||||||||||||||||
| �� | Average Balance | �� | Interest & Dividends | �� | Yield / Cost (1) | �� | Average Balance | �� | Interest & Dividends | �� | Yield / Cost (1) | �� | Average Balance | �� | Interest & Dividends | �� | Yield / Cost (1) | ||||||||||||||||||
| Assets | �� | �� | �� | �� | �� | �� | �� | �� | �� | �� | �� | �� | �� | �� | �� | �� | �� | ||||||||||||||||||
| Interest earning assets: | �� | �� | �� | �� | �� | �� | �� | �� | �� | �� | �� | �� | �� | �� | �� | �� | �� | ||||||||||||||||||
| Interest earning deposits with other banks | $ | 553,393 | �� | �� | $ | 6,070 | �� | �� | �� | 4.45 | % | �� | $ | 501,654 | �� | �� | $ | 6,021 | �� | �� | �� | 4.77 | % | �� | $ | 350,868 | �� | �� | $ | 4,780 | �� | �� | �� | 5.48 | % |
| Investment securities, available for sale (2) | �� | 37 | �� | �� | �� | 1 | �� | �� | �� | 10.96 | �� | �� | �� | 39 | �� | �� | �� | �� | �� | �� | �� | �� | �� | �� | �� | 64,878 | �� | �� | �� | 349 | �� | �� | �� | 2.16 | �� |
| Investment securities, held to maturity (2) | �� | 47,154 | �� | �� | �� | 649 | �� | �� | �� | 5.58 | �� | �� | �� | 48,126 | �� | �� | �� | 661 | �� | �� | �� | 5.46 | �� | �� | �� | 50,490 | �� | �� | �� | 685 | �� | �� | �� | 5.46 | �� |
| Other investments | �� | 11,757 | �� | �� | �� | 40 | �� | �� | �� | 1.38 | �� | �� | �� | 10,783 | �� | �� | �� | 191 | �� | �� | �� | 7.05 | �� | �� | �� | 10,262 | �� | �� | �� | 37 | �� | �� | �� | 1.45 | �� |
| Loans receivable (3) | �� | 3,511,724 | �� | �� | �� | 98,147 | �� | �� | �� | 11.33 | �� | �� | �� | 3,419,476 | �� | �� | �� | 95,575 | �� | �� | �� | 11.12 | �� | �� | �� | 3,137,271 | �� | �� | �� | 85,891 | �� | �� | �� | 11.01 | �� |
| Total interest earning assets | �� | 4,124,065 | �� | �� | �� | 104,907 | �� | �� | �� | 10.32 | �� | �� | �� | 3,980,078 | �� | �� | �� | 102,448 | �� | �� | �� | 10.24 | �� | �� | �� | 3,613,769 | �� | �� | �� | 91,742 | �� | �� | �� | 10.21 | �� |
| Noninterest earning assets: | �� | �� | �� | �� | �� | �� | �� | �� | �� | �� | �� | �� | �� | �� | �� | �� | �� | ||||||||||||||||||
| Allowance for credit losses | �� | (170,542 | ) | �� | �� | �� | �� | �� | �� | (156,687 | ) | �� | �� | �� | �� | �� | �� | (114,985 | ) | �� | �� | �� | �� | ||||||||||||
| Other noninterest earning assets | �� | 296,993 | �� | �� | �� | �� | �� | �� | �� | 277,922 | �� | �� | �� | �� | �� | �� | �� | 229,437 | �� | �� | �� | �� | �� | ||||||||||||
| Total assets | $ | 4,250,516 | �� | �� | �� | �� | �� | �� | $ | 4,101,313 | �� | �� | �� | �� | �� | �� | $ | 3,728,221 | �� | �� | �� | �� | �� | ||||||||||||
| �� | �� | �� | �� | �� | �� | �� | �� | �� | �� | �� | �� | �� | �� | �� | �� | �� | �� | ||||||||||||||||||
| Liabilities and Shareholders�� Equity | �� | �� | �� | �� | �� | �� | �� | �� | �� | �� | �� | �� | �� | �� | �� | �� | �� | ||||||||||||||||||
| Interest bearing liabilities: | �� | �� | �� | �� | �� | �� | �� | �� | �� | �� | �� | �� | �� | �� | �� | �� | �� | ||||||||||||||||||
| Interest bearing deposits | $ | 3,166,384 | �� | �� | $ | 28,185 | �� | �� | �� | 3.61 | % | �� | $ | 3,068,357 | �� | �� | $ | 29,404 | �� | �� | �� | 3.81 | % | �� | $ | 2,728,884 | �� | �� | $ | 28,867 | �� | �� | �� | 4.25 | % |
| FHLB advances and other borrowings | �� | �� | �� | �� | �� | 1 | �� | �� | �� | �� | �� | �� | �� | �� | �� | �� | �� | 1 | �� | �� | �� | �� | �� | �� | �� | 5 | �� | �� | �� | �� | �� | �� | �� | �� | �� |
| Subordinated debt | �� | 44,309 | �� | �� | �� | 598 | �� | �� | �� | 5.47 | �� | �� | �� | 44,272 | �� | �� | �� | 599 | �� | �� | �� | 5.38 | �� | �� | �� | 44,159 | �� | �� | �� | 598 | �� | �� | �� | 5.45 | �� |
| Junior subordinated debentures | �� | 3,592 | �� | �� | �� | 61 | �� | �� | �� | 6.89 | �� | �� | �� | 3,591 | �� | �� | �� | 67 | �� | �� | �� | 7.42 | �� | �� | �� | 3,590 | �� | �� | �� | 71 | �� | �� | �� | 7.95 | �� |
| Total interest bearing liabilities | �� | 3,214,285 | �� | �� | �� | 28,845 | �� | �� | �� | 3.64 | �� | �� | �� | 3,116,220 | �� | �� | �� | 30,071 | �� | �� | �� | 3.84 | �� | �� | �� | 2,776,638 | �� | �� | �� | 29,536 | �� | �� | �� | 4.28 | �� |
| Noninterest bearing deposits | �� | 543,784 | �� | �� | �� | �� | �� | �� | �� | 577,453 | �� | �� | �� | �� | �� | �� | �� | 595,693 | �� | �� | �� | �� | �� | ||||||||||||
| Other liabilities | �� | 49,624 | �� | �� | �� | �� | �� | �� | �� | 50,824 | �� | �� | �� | �� | �� | �� | �� | 58,829 | �� | �� | �� | �� | �� | ||||||||||||
| Total shareholders' equity | �� | 442,823 | �� | �� | �� | �� | �� | �� | �� | 356,816 | �� | �� | �� | �� | �� | �� | �� | 297,061 | �� | �� | �� | �� | �� | ||||||||||||
| Total liabilities and shareholders' equity | $ | 4,250,516 | �� | �� | �� | �� | �� | �� | $ | 4,101,313 | �� | �� | �� | �� | �� | �� | $ | 3,728,221 | �� | �� | �� | �� | �� | ||||||||||||
| Net interest income | �� | �� | $ | 76,062 | �� | �� | �� | �� | �� | �� | $ | 72,377 | �� | �� | �� | �� | �� | �� | $ | 62,206 | �� | �� | �� | ||||||||||||
| Interest rate spread | �� | �� | �� | �� | �� | 6.68 | % | �� | �� | �� | �� | �� | �� | 6.40 | % | �� | �� | �� | �� | �� | �� | 5.93 | % | ||||||||||||
| Net interest margin (4) | �� | �� | �� | �� | �� | 7.48 | % | �� | �� | �� | �� | �� | �� | 7.23 | % | �� | �� | �� | �� | �� | �� | 6.92 | % | ||||||||||||
| (1) | Yields and costs are annualized. |
| (2) | For presentation in this table, average balances and the corresponding average rates for investment securities are based upon historical cost, adjusted for amortization of premiums and accretion of discounts. |
| (3) | Includes loans held for sale and nonaccrual loans. |
| (4) | Net interest margin represents net interest income divided by the average total interest earning assets. |
| �� | �� |
COASTAL FINANCIAL CORPORATION
SELECTED AVERAGE BALANCES, YIELDS, AND RATES �� BY SEGMENT - QUARTERLY
(Dollars in thousands; unaudited)
| �� | For the Three Months Ended | |||||||||||||||||||||||||||||||
| �� | March 31, 2025 | �� | December 31, 2024 | �� | March 31, 2024 | |||||||||||||||||||||||||||
| (dollars in thousands, unaudited) | Average Balance | �� | Interest & Dividends | �� | Yield / Cost (1) | �� | Average Balance | �� | Interest & Dividends | �� | Yield / Cost (1) | �� | Average Balance | �� | Interest & Dividends | �� | Yield / Cost (1) | |||||||||||||||
| Community Bank | �� | �� | �� | �� | �� | �� | �� | �� | �� | �� | �� | �� | �� | �� | �� | �� | �� | |||||||||||||||
| Assets | �� | �� | �� | �� | �� | �� | �� | �� | �� | �� | �� | �� | �� | �� | �� | �� | �� | |||||||||||||||
| Interest earning assets: | �� | �� | �� | �� | �� | �� | �� | �� | �� | �� | �� | �� | �� | �� | �� | �� | �� | |||||||||||||||
| Loans receivable (2) | $ | 1,881,636 | �� | �� | $ | 30,292 | �� | �� | 6.53 | % | �� | $ | 1,892,298 | �� | �� | $ | 31,043 | �� | �� | 6.53 | % | �� | $ | 1,871,414 | �� | �� | $ | 30,052 | �� | �� | 6.46 | % |
| Total interest earning��assets | �� | 1,881,636 | �� | �� | �� | 30,292 | �� | �� | 6.53 | �� | �� | �� | 1,892,298 | �� | �� | �� | 31,043 | �� | �� | 6.53 | �� | �� | �� | 1,871,414 | �� | �� | �� | 30,052 | �� | �� | 6.46 | �� |
| Liabilities | �� | �� | �� | �� | �� | �� | �� | �� | �� | �� | �� | �� | �� | �� | �� | �� | �� | |||||||||||||||
| Interest bearing liabilities: | �� | �� | �� | �� | �� | �� | �� | �� | �� | �� | �� | �� | �� | �� | �� | �� | ||||||||||||||||
| Interest bearing��deposits | �� | 1,045,971 | �� | �� | �� | 6,604 | �� | �� | 2.56 | % | �� | �� | 1,029,346 | �� | �� | �� | 7,161 | �� | �� | 2.77 | % | �� | �� | 922,340 | �� | �� | �� | 6,013 | �� | �� | 2.62 | % |
| Intrabank liability | �� | 356,337 | �� | �� | �� | 3,909 | �� | �� | 4.45 | �� | �� | �� | 357,442 | �� | �� | �� | 4,290 | �� | �� | 4.77 | �� | �� | �� | 410,993 | �� | �� | �� | 5,599 | �� | �� | 5.48 | �� |
| Total interest bearing��liabilities | �� | 1,402,308 | �� | �� | �� | 10,513 | �� | �� | 3.04 | �� | �� | �� | 1,386,788 | �� | �� | �� | 11,451 | �� | �� | 3.28 | �� | �� | �� | 1,333,333 | �� | �� | �� | 11,612 | �� | �� | 3.50 | �� |
| Noninterest bearing��deposits | �� | 479,329 | �� | �� | �� | �� | �� | �� | �� | 505,510 | �� | �� | �� | �� | �� | �� | �� | 538,081 | �� | �� | �� | �� | �� | |||||||||
| Net interest income | �� | �� | $ | 19,779 | �� | �� | �� | �� | �� | �� | $ | 19,592 | �� | �� | �� | �� | �� | �� | $ | 18,440 | �� | �� | �� | |||||||||
| Net interest margin(3) | �� | �� | �� | �� | 4.26 | % | �� | �� | �� | �� | �� | 4.12 | % | �� | �� | �� | �� | �� | 3.96 | % | ||||||||||||
| �� | �� | �� | �� | �� | �� | �� | �� | �� | �� | �� | �� | �� | �� | �� | �� | �� | �� | |||||||||||||||
| CCBX | �� | �� | �� | �� | �� | �� | �� | �� | �� | �� | �� | �� | �� | �� | �� | �� | �� | |||||||||||||||
| Assets | �� | �� | �� | �� | �� | �� | �� | �� | �� | �� | �� | �� | �� | �� | �� | �� | �� | |||||||||||||||
| Interest earning assets: | �� | �� | �� | �� | �� | �� | �� | �� | �� | �� | �� | �� | �� | �� | �� | �� | �� | |||||||||||||||
| Loans receivable (2)(4) | $ | 1,630,088 | �� | �� | $ | 67,855 | �� | �� | 16.88 | % | �� | $ | 1,527,178 | �� | �� | $ | 64,532 | �� | �� | 16.81 | % | �� | $ | 1,265,857 | �� | �� | $ | 55,839 | �� | �� | 17.74 | % |
| Intrabank asset | �� | 554,781 | �� | �� | �� | 6,085 | �� | �� | 4.45 | �� | �� | �� | 583,776 | �� | �� | �� | 7,007 | �� | �� | 4.78 | �� | �� | �� | 598,299 | �� | �� | �� | 8,151 | �� | �� | 5.48 | �� |
| Total interest earning��assets | �� | 2,184,869 | �� | �� | �� | 73,940 | �� | �� | 13.72 | �� | �� | �� | 2,110,954 | �� | �� | �� | 71,539 | �� | �� | 13.48 | �� | �� | �� | 1,864,156 | �� | �� | �� | 63,990 | �� | �� | 13.81 | �� |
| Liabilities | �� | �� | �� | �� | �� | �� | �� | �� | �� | �� | �� | �� | �� | �� | �� | �� | �� | |||||||||||||||
| Interest bearing liabilities: | �� | �� | �� | �� | �� | �� | �� | �� | �� | �� | �� | �� | �� | �� | ||||||||||||||||||
| Interest bearing��deposits | �� | 2,120,413 | �� | �� | �� | 21,581 | �� | �� | 4.13 | % | �� | �� | 2,039,011 | �� | �� | �� | 22,243 | �� | �� | 4.34 | % | �� | �� | 1,806,544 | �� | �� | �� | 22,854 | �� | �� | 5.09 | % |
| Total interest bearing��liabilities | �� | 2,120,413 | �� | �� | �� | 21,581 | �� | �� | 4.13 | �� | �� | �� | 2,039,011 | �� | �� | �� | 22,243 | �� | �� | 4.34 | �� | �� | �� | 1,806,544 | �� | �� | �� | 22,854 | �� | �� | 5.09 | �� |
| Noninterest bearing��deposits | �� | 64,455 | �� | �� | �� | �� | �� | �� | �� | 71,943 | �� | �� | �� | �� | �� | �� | �� | 57,612 | �� | �� | �� | �� | �� | |||||||||
| Net interest income | �� | �� | $ | 52,359 | �� | �� | �� | �� | �� | �� | $ | 49,296 | �� | �� | �� | �� | �� | �� | $ | 41,136 | �� | �� | �� | |||||||||
| Net interest margin(3) | �� | �� | �� | �� | 9.72 | % | �� | �� | �� | �� | �� | 9.29 | % | �� | �� | �� | �� | �� | 8.88 | % | ||||||||||||
| Net interest margin, net��of BaaS loan expense(5) | �� | �� | �� | �� | 3.68 | % | �� | �� | �� | �� | �� | 3.50 | % | �� | �� | �� | �� | �� | 3.24 | % | ||||||||||||
| �� | �� | �� | �� | �� | �� | �� | �� | �� | �� | �� | �� | �� | �� | �� | �� | �� | �� | �� | �� | �� | ||||||||||||
| �� | For the Three Months Ended | |||||||||||||||||||||||||||||||
| �� | March 31, 2025 | �� | December 31, 2024 | �� | March 31, 2024 | |||||||||||||||||||||||||||
| (dollars in thousands, unaudited) | Average Balance | �� | Interest & Dividends | �� | Yield / Cost (1) | �� | Average Balance | �� | Interest & Dividends | �� | Yield / Cost (1) | �� | Average Balance | �� | Interest & Dividends | �� | Yield / Cost (1) | |||||||||||||||
| Treasury & Administration | �� | �� | �� | �� | �� | �� | �� | �� | �� | �� | �� | �� | �� | �� | ||||||||||||||||||
| Assets | �� | �� | �� | �� | �� | �� | �� | �� | �� | �� | �� | �� | �� | �� | �� | �� | �� | |||||||||||||||
| Interest earning assets: | �� | �� | �� | �� | �� | �� | �� | �� | �� | �� | �� | �� | �� | �� | �� | �� | �� | |||||||||||||||
| Interest earning deposits with other banks | $ | 553,393 | �� | �� | $ | 6,070 | �� | �� | 4.45 | % | �� | $ | 501,654 | �� | �� | $ | 6,021 | �� | �� | 4.77 | % | �� | $ | 350,868 | �� | �� | $ | 4,780 | �� | �� | 5.48 | % |
| Investment securities, available for sale (6) | �� | 37 | �� | �� | �� | 1 | �� | �� | 10.96 | �� | �� | �� | 39 | �� | �� | �� | �� | �� | �� | �� | �� | �� | �� | 64,878 | �� | �� | �� | 349 | �� | �� | 2.16 | �� |
| Investment securities, held to maturity (6) | �� | 47,154 | �� | �� | �� | 649 | �� | �� | 5.58 | �� | �� | �� | 48,126 | �� | �� | �� | 661 | �� | �� | 5.46 | �� | �� | �� | 50,490 | �� | �� | �� | 685 | �� | �� | 5.46 | �� |
| Other investments | �� | 11,757 | �� | �� | �� | 40 | �� | �� | 1.38 | �� | �� | �� | 10,783 | �� | �� | �� | 191 | �� | �� | 7.05 | �� | �� | �� | 10,262 | �� | �� | �� | 37 | �� | �� | 1.45 | �� |
| Total interest earning assets | �� | 612,341 | �� | �� | �� | 6,760 | �� | �� | 4.48 | % | �� | �� | 560,602 | �� | �� | �� | 6,873 | �� | �� | 4.88 | % | �� | �� | 476,498 | �� | �� | �� | 5,851 | �� | �� | 4.94 | % |
| Liabilities | �� | �� | �� | �� | �� | �� | �� | �� | �� | �� | �� | �� | �� | �� | �� | �� | �� | |||||||||||||||
| Interest bearing liabilities: | �� | �� | �� | �� | �� | �� | �� | �� | �� | �� | �� | �� | �� | �� | �� | �� | �� | |||||||||||||||
| FHLB advances and borrowings | $ | �� | �� | �� | �� | 1 | �� | �� | �� | % | �� | $ | �� | �� | �� | �� | 1 | �� | �� | �� | % | �� | $ | 5 | �� | �� | �� | �� | �� | �� | �� | % |
| Subordinated debt | �� | 44,309 | �� | �� | �� | 598 | �� | �� | 5.47 | % | �� | �� | 44,272 | �� | �� | �� | 599 | �� | �� | 5.38 | % | �� | �� | 44,159 | �� | �� | �� | 598 | �� | �� | 5.45 | % |
| Junior subordinated debentures | �� | 3,592 | �� | �� | �� | 61 | �� | �� | 6.89 | �� | �� | �� | 3,591 | �� | �� | �� | 67 | �� | �� | 7.42 | �� | �� | �� | 3,590 | �� | �� | �� | 71 | �� | �� | 7.95 | �� |
| Intrabank liability, net (7) | �� | 198,444 | �� | �� | �� | 2,176 | �� | �� | 4.45 | �� | �� | �� | 226,334 | �� | �� | �� | 2,717 | �� | �� | 4.78 | �� | �� | �� | 187,306 | �� | �� | �� | 2,552 | �� | �� | 5.48 | �� |
| Total interest bearing liabilities | �� | 246,345 | �� | �� | �� | 2,836 | �� | �� | 4.67 | �� | �� | �� | 274,197 | �� | �� | �� | 3,384 | �� | �� | 4.91 | �� | �� | �� | 235,060 | �� | �� | �� | 3,221 | �� | �� | 5.51 | �� |
| Net interest income | �� | �� | $ | 3,924 | �� | �� | �� | �� | �� | �� | $ | 3,489 | �� | �� | �� | �� | �� | �� | $ | 2,630 | �� | �� | �� | |||||||||
| Net interest margin(3) | �� | �� | �� | �� | 2.60 | % | �� | �� | �� | �� | �� | 2.48 | % | �� | �� | �� | �� | �� | 2.22 | % | ||||||||||||
| (1) | ��Yields and costs are annualized. |
| (2) | Includes loans held for sale and nonaccrual loans. |
| (3) | ��Net interest margin represents net interest income divided by the average total interest earning assets. |
| (4) | CCBX yield does not include the impact of BaaS loan expense. BaaS loan expense represents the amount paid or payable to partners for credit enhancements, fraud enhancements and originating & servicing CCBX loans. See reconciliation of the non-GAAP measures at the end of this earnings release for the impact of BaaS loan expense on CCBX loan yield. |
| (5) | Net interest margin, net of BaaS loan expense, includes the impact of BaaS loan expense. BaaS loan expense represents the amount paid or payable to partners for credit enhancements, fraud enhancements, originating & servicing CCBX loans. See reconciliation of the non-GAAP measures at the end of this earnings release. |
| (6) | For presentation in this table, average balances and the corresponding average rates for investment securities are based upon historical cost, adjusted for amortization of premiums and accretion of discounts. |
| (7) | ��Intrabank assets and liabilities are consolidated for period calculations and presented as intrabank asset, net or intrabank liability, net in the table above. |
| �� | �� |
Non-GAAP Financial Measures
The Company uses certain non-GAAP financial measures to provide meaningful supplemental information regarding the Company’s operational performance and to enhance investors�� overall understanding of such financial performance.
However, these non-GAAP financial measures are supplemental and are not a substitute for an analysis based on GAAP measures. As other companies may use different calculations for these adjusted measures, this presentation may not be comparable to other similarly titled adjusted measures reported by other companies.
The following non-GAAP measures are presented to illustrate the impact of BaaS loan expense on net loan income and yield on loans and CCBX loans and the impact of BaaS loan expense on net interest income and net interest margin.
Loan income, net of BaaS loan expense, divided by average loans, is a non-GAAP measure that includes the impact BaaS loan expense on loan income and the yield on loans. The most directly comparable GAAP measure is yield on loans.
Net BaaS loan income divided by average CCBX loans is a non-GAAP measure that includes the impact BaaS loan expense on net BaaS loan income and the yield on CCBX loans. The most directly comparable GAAP measure is yield on CCBX loans.
Net interest income, net of BaaS loan expense, is a non-GAAP measure that includes the impact BaaS loan expense on net interest income. The most directly comparable GAAP measure is net interest income.
CCBX net interest margin, net of BaaS loan expense, is a non-GAAP measure that includes the impact of BaaS loan expense on net interest rate margin. The most directly comparable GAAP measure is CCBX net interest margin.
Reconciliations of the GAAP and non-GAAP measures are presented below.
| CCBX | �� | As of and for the Three Months Ended | ||||||||||
| (dollars in thousands; unaudited) | �� | March 31 2025 | �� | December 31 2024 | �� | March 31 2024 | ||||||
| Net BaaS loan income divided by average CCBX loans: | ||||||||||||
| CCBX loan yield (GAAP)(1) | �� | �� | 16.88 | % | �� | �� | 16.81 | % | �� | �� | 17.74 | % |
| Total average CCBX loans receivable | �� | $ | 1,630,088 | �� | �� | $ | 1,527,178 | �� | �� | $ | 1,265,857 | �� |
| Interest and earned fee income on CCBX loans (GAAP) | �� | �� | 67,855 | �� | �� | �� | 64,532 | �� | �� | �� | 55,839 | �� |
| BaaS loan expense | �� | �� | (32,507 | ) | �� | �� | (30,720 | ) | �� | �� | (26,107 | ) |
| Net BaaS loan income | �� | $ | 35,348 | �� | �� | $ | 33,812 | �� | �� | $ | 29,732 | �� |
| Net BaaS loan income divided by average CCBX loans (1) | �� | �� | 8.79 | % | �� | �� | 8.81 | % | �� | �� | 9.45 | % |
| CCBX net interest margin, net of BaaS loan expense: | �� | �� | �� | �� | ||||||||
| CCBX net interest margin (1) | �� | �� | 9.72 | % | �� | �� | 9.29 | % | �� | �� | 8.88 | % |
| CCBX earning assets | �� | �� | 2,184,869 | �� | �� | �� | 2,110,954 | �� | �� | �� | 1,864,156 | �� |
| Net interest income (GAAP) | �� | �� | 52,359 | �� | �� | �� | 49,296 | �� | �� | �� | 41,136 | �� |
| Less: BaaS loan expense | �� | �� | (32,507 | ) | �� | �� | (30,720 | ) | �� | �� | (26,107 | ) |
| Net interest income, net of BaaS��loan expense | �� | $ | 19,852 | �� | �� | $ | 18,576 | �� | �� | $ | 15,029 | �� |
| CCBX net interest margin, net of BaaS loan expense (1) | �� | �� | 3.68 | % | �� | �� | 3.50 | % | �� | �� | 3.24 | % |
| �� | �� | �� | �� | �� | �� | �� | �� | �� | �� | �� | �� | �� |
| Consolidated | �� | As of and for the Three Months Ended | ||||||||||
| (dollars in thousands; unaudited) | �� | March 31 2025 | �� | December 31 2024 | �� | March 31 2024 | ||||||
| Net interest margin, net of BaaS loan expense: | �� | �� | �� | �� | ||||||||
| Net interest margin (1) | �� | �� | 7.48 | % | �� | �� | 7.23 | % | �� | �� | 6.92 | % |
| Earning assets | �� | �� | 4,124,065 | �� | �� | �� | 3,980,078 | �� | �� | �� | 3,613,769 | �� |
| Net interest income (GAAP) | �� | �� | 76,062 | �� | �� | �� | 72,377 | �� | �� | �� | 62,206 | �� |
| Less: BaaS loan expense | �� | �� | (32,507 | ) | �� | �� | (30,720 | ) | �� | �� | (26,107 | ) |
| Net interest income, net of BaaS loan expense | �� | $ | 43,555 | �� | �� | $ | 41,657 | �� | �� | $ | 36,099 | �� |
| Net interest margin, net of BaaS loan expense (1) | �� | �� | 4.28 | % | �� | �� | 4.16 | % | �� | �� | 4.02 | % |
| Loan income net of BaaS loan expense divided by average loans: | �� | �� | ||||||||||
| Loan yield (GAAP)(1) | �� | �� | 11.33 | % | �� | �� | 11.12 | % | �� | �� | 11.01 | % |
| Total average loans receivable | �� | $ | 3,511,724 | �� | �� | $ | 3,419,476 | �� | �� | $ | 3,137,271 | �� |
| Interest and earned fee income on loans (GAAP) | �� | �� | 98,147 | �� | �� | �� | 95,575 | �� | �� | �� | 85,891 | �� |
| BaaS loan expense | �� | �� | (32,507 | ) | �� | �� | (30,720 | ) | �� | �� | (26,107 | ) |
| Net loan income | �� | $ | 65,640 | �� | �� | $ | 64,855 | �� | �� | $ | 59,784 | �� |
| Loan income, net of BaaS loan expense, divided by average loans (1) | �� | �� | 7.58 | % | �� | �� | 7.55 | % | �� | �� | 7.66 | % |
| (1) | Annualized calculations for periods presented. |
| �� | �� |
The following non-GAAP measure is presented to illustrate the impact of BaaS loan expense, BaaS fraud expense and reimbursement of expenses (BaaS) on noninterest expense. Certain noninterest expenses are reimbursed by our CCBX partners. In accordance with GAAP we recognize all expenses in noninterest expense and the reimbursement of expenses from our CCBX partner in noninterest income. This non-GAAP measure shows the portion of noninterest expenses that are reimbursed by partners to assist the understanding of how the increases in noninterest expense are related to expenses incurred for and reimbursed by CCBX partner. The most comparable GAAP measure is noninterest expense.
| �� | �� | As of and for the Three Months Ended | ||||||||||
| (dollars in thousands, unaudited) | �� | March 31, 2025 | �� | December 31, 2024 | �� | March 31, 2024 | ||||||
| Noninterest expense, net of reimbursement of expenses (BaaS) | ||||||||||||
| Noninterest expense (GAAP) | �� | $ | 71,989 | �� | �� | $ | 67,411 | �� | �� | $ | 56,509 | �� |
| Less: BaaS loan expense | �� | �� | 32,507 | �� | �� | �� | 30,720 | �� | �� | �� | 26,107 | �� |
| Less: BaaS fraud expense | �� | �� | 1,993 | �� | �� | �� | 5,043 | �� | �� | �� | 923 | �� |
| Less: Reimbursement of expenses | �� | �� | 1,026 | �� | �� | �� | 812 | �� | �� | �� | 254 | �� |
| Noninterest expense, net of BaaS loan expense, BaaS fraud expense and reimbursement of expenses | �� | $ | 36,463 | �� | �� | $ | 30,836 | �� | �� | $ | 29,225 | �� |
| �� | �� | �� | �� | �� | �� | �� | �� | �� | �� | �� | �� | �� |
APPENDIX A -
As of March��31, 2025
Industry Concentration
We have a diversified loan portfolio, representing a wide variety of industries. Our major categories of loans are commercial real estate, consumer and other loans, residential real estate, commercial and industrial, and construction, land and land development loans. Together they represent
Commercial real estate loans represent the largest segment of our loans, comprising
The following table summarizes our loan commitment by industry for our commercial real estate portfolio as of March��31, 2025:
| (dollars in thousands; unaudited) | �� | Outstanding Balance | �� | Available Loan Commitments | �� | Total Outstanding Balance & Available Commitment | �� | % of Total Loans (Outstanding Balance & Available Commitment) | �� | Average Loan Balance | �� | Number of Loans | ||||||||||
| Apartments | �� | $ | 392,740 | �� | �� | $ | 4,488 | �� | �� | $ | 397,228 | �� | �� | 7.0 | % | �� | $ | 3,927 | �� | �� | 100 | �� |
| Hotel/Motel | �� | �� | 149,859 | �� | �� | �� | 61 | �� | �� | �� | 149,920 | �� | �� | 2.6 | �� | �� | �� | 6,516 | �� | �� | 23 | �� |
| Convenience Store | �� | �� | 138,838 | �� | �� | �� | 561 | �� | �� | �� | 139,399 | �� | �� | 2.5 | �� | �� | �� | 2,314 | �� | �� | 60 | �� |
| Office | �� | �� | 121,346 | �� | �� | �� | 7,183 | �� | �� | �� | 128,529 | �� | �� | 2.3 | �� | �� | �� | 1,379 | �� | �� | 88 | �� |
| Retail | �� | �� | 101,118 | �� | �� | �� | 744 | �� | �� | �� | 101,862 | �� | �� | 1.8 | �� | �� | �� | 972 | �� | �� | 104 | �� |
| Warehouse | �� | �� | 103,813 | �� | �� | �� | �� | �� | �� | �� | 103,813 | �� | �� | 1.8 | �� | �� | �� | 1,790 | �� | �� | 58 | �� |
| Mixed use | �� | �� | 91,025 | �� | �� | �� | 5,220 | �� | �� | �� | 96,245 | �� | �� | 1.7 | �� | �� | �� | 1,167 | �� | �� | 78 | �� |
| Mini Storage | �� | �� | 73,172 | �� | �� | �� | 8,022 | �� | �� | �� | 81,194 | �� | �� | 1.4 | �� | �� | �� | 3,659 | �� | �� | 20 | �� |
| Strip Mall | �� | �� | 43,678 | �� | �� | �� | �� | �� | �� | �� | 43,678 | �� | �� | 0.8 | �� | �� | �� | 6,240 | �� | �� | 7 | �� |
| Manufacturing | �� | �� | 36,887 | �� | �� | �� | 370 | �� | �� | �� | 37,257 | �� | �� | 0.7 | �� | �� | �� | 1,272 | �� | �� | 29 | �� |
| Groups < | �� | �� | 88,171 | �� | �� | �� | 2,752 | �� | �� | �� | 90,923 | �� | �� | 1.6 | �� | �� | �� | 1,145 | �� | �� | 77 | �� |
| Total | �� | $ | 1,340,647 | �� | �� | $ | 29,401 | �� | �� | $ | 1,370,048 | �� | �� | 24.2 | % | �� | $ | 2,082 | �� | �� | 644 | �� |
| �� | �� | �� | �� | �� | �� | �� | �� | �� | �� | �� | �� | �� | �� | �� | �� | �� | �� | �� | �� | �� | �� | �� |
Consumer loans comprise
The following table summarizes our loan commitment by industry for our consumer and other loan portfolio as of March��31, 2025:
| (dollars in thousands; unaudited) | �� | Outstanding Balance | �� | Available Loan Commitments (1) | �� | Total Outstanding Balance & Available Commitment (1) | �� | % of Total Loans (Outstanding Balance & Available Commitment) | �� | Average Loan Balance | �� | Number of Loans | ||||||||||
| CCBX consumer loans | ||||||||||||||||||||||
| Credit cards | �� | $ | 532,775 | �� | �� | $ | 868,969 | �� | �� | $ | 1,401,744 | �� | �� | 24.7 | % | �� | $ | 1.7 | �� | �� | 314,203 | �� |
| Installment loans | �� | �� | 654,844 | �� | �� | �� | 29,027 | �� | �� | �� | 683,871 | �� | �� | 12.1 | �� | �� | �� | 0.8 | �� | �� | 776,669 | �� |
| Lines of credit | �� | �� | 627 | �� | �� | �� | 2 | �� | �� | �� | 629 | �� | �� | 0.0 | �� | �� | �� | 1.3 | �� | �� | 477 | �� |
| Other loans | �� | �� | 14,555 | �� | �� | �� | �� | �� | �� | �� | 14,555 | �� | �� | 0.3 | �� | �� | �� | 0.1 | �� | �� | 185,894 | �� |
| Community bank consumer loans | ||||||||||||||||||||||
| Installment loans | �� | �� | 1,846 | �� | �� | �� | 3 | �� | �� | �� | 1,849 | �� | �� | 0.0 | �� | �� | �� | 65.9 | �� | �� | 28 | �� |
| Lines of credit | �� | �� | 173 | �� | �� | �� | 357 | �� | �� | �� | 530 | �� | �� | 0.0 | �� | �� | �� | 5.2 | �� | �� | 33 | �� |
| Other loans | �� | �� | 11,307 | �� | �� | �� | 12,400 | �� | �� | �� | 23,707 | �� | �� | 0.4 | �� | �� | �� | 34.6 | �� | �� | 327 | �� |
| Total | �� | $ | 1,216,127 | �� | �� | $ | 910,758 | �� | �� | $ | 2,126,885 | �� | �� | 37.5 | % | �� | $ | 1.0 | �� | �� | 1,277,631 | �� |
(1)����Total exposure on CCBX loans is subject to CCBX partner/portfolio maximum limits.
Residential real estate loans comprise
The following table summarizes our loan commitment by industry for our residential real estate loan portfolio as of March��31, 2025:
| (dollars in thousands; unaudited) | �� | Outstanding Balance | �� | Available Loan Commitments (1) | �� | Total Outstanding Balance & Available Commitment (1) | �� | % of Total Loans (Outstanding Balance & Available Commitment) | �� | Average Loan Balance | �� | Number of Loans | ||||||||||
| CCBX residential real estate loans | ||||||||||||||||||||||
| Home equity line of credit | �� | $ | 285,355 | �� | �� | $ | 481,778 | �� | �� | $ | 767,133 | �� | �� | 13.5 | % | �� | $ | 28 | �� | �� | 10,291 | �� |
| Community bank residential real estate loans | ||||||||||||||||||||||
| Closed end, secured by first liens | �� | �� | 164,284 | �� | �� | �� | 1,649 | �� | �� | �� | 165,933 | �� | �� | 3.0 | �� | �� | �� | 533 | �� | �� | 308 | �� |
| Home equity line of credit | �� | �� | 27,931 | �� | �� | �� | 45,016 | �� | �� | �� | 72,947 | �� | �� | 1.3 | �� | �� | �� | 115 | �� | �� | 242 | �� |
| Closed end, second liens | �� | �� | 10,705 | �� | �� | �� | 892 | �� | �� | �� | 11,597 | �� | �� | 0.2 | �� | �� | �� | 357 | �� | �� | 30 | �� |
| Total | �� | $ | 488,275 | �� | �� | $ | 529,335 | �� | �� | $ | 1,017,610 | �� | �� | 18.0 | % | �� | $ | 45 | �� | �� | 10,871 | �� |
(1)����Total exposure on CCBX loans is subject to CCBX partner/portfolio maximum limits. CCBX home equity lines of credit are limited to a
Commercial and industrial loans comprise
The following table summarizes our loan commitment by industry for our commercial and industrial loan portfolio as of March��31, 2025:
| (dollars in thousands; unaudited) | �� | Outstanding Balance | �� | Available Loan Commitments (1) | �� | Total Outstanding Balance & Available Commitment (1) | �� | % of Total Loans (Outstanding Balance & Available Commitment) | �� | Average Loan Balance | �� | Number of Loans | ||||||||||
| CCBX C&I Loans | ||||||||||||||||||||||
| Capital Call Lines | �� | $ | 133,466 | �� | �� | $ | 514,864 | �� | �� | $ | 648,330 | �� | �� | 11.4 | % | �� | $ | 1,019 | �� | �� | 131 | �� |
| Retail and other loans | �� | �� | 29,702 | �� | �� | �� | 21,736 | �� | �� | �� | 51,438 | �� | �� | 0.9 | �� | �� | �� | 10 | �� | �� | 3,002 | �� |
| Community bank C&I Loans | ||||||||||||||||||||||
| Construction/Contractor Services | �� | �� | 30,768 | �� | �� | �� | 31,642 | �� | �� | �� | 62,410 | �� | �� | 1.1 | �� | �� | �� | 152 | �� | �� | 202 | �� |
| Financial Institutions | �� | �� | 48,648 | �� | �� | �� | �� | �� | �� | �� | 48,648 | �� | �� | 0.9 | �� | �� | �� | 4,054 | �� | �� | 12 | �� |
| Medical / Dental / Other Care | �� | �� | 6,721 | �� | �� | �� | 2,739 | �� | �� | �� | 9,460 | �� | �� | 0.2 | �� | �� | �� | 517 | �� | �� | 13 | �� |
| Manufacturing | �� | �� | 5,611 | �� | �� | �� | 4,022 | �� | �� | �� | 9,633 | �� | �� | 0.2 | �� | �� | �� | 156 | �� | �� | 36 | �� |
| Groups < | �� | �� | 57,356 | �� | �� | �� | 25,969 | �� | �� | �� | 83,325 | �� | �� | 1.4 | �� | �� | �� | 222 | �� | �� | 258 | �� |
| Total | �� | $ | 312,272 | �� | �� | $ | 600,972 | �� | �� | $ | 913,244 | �� | �� | 16.1 | % | �� | $ | 85 | �� | �� | 3,654 | �� |
(1) Total exposure on CCBX loans is subject to CCBX partner/portfolio maximum limits.
Construction, land and land development loans comprise
The following table details our loan commitment for our construction, land and land development portfolio as of March��31, 2025:
| (dollars in thousands; unaudited) | �� | Outstanding Balance | �� | Available Loan Commitments | �� | Total Outstanding Balance & Available Commitment | �� | % of Total Loans (Outstanding Balance & Available Commitment) | �� | Average Loan Balance | �� | Number of Loans | �� | |||||||||
| Commercial construction | �� | $ | 96,716 | �� | �� | $ | 41,654 | �� | �� | $ | 138,370 | �� | �� | 2.4 | % | �� | $ | 6,908 | �� | �� | 14 | �� |
| Residential construction | �� | �� | 39,375 | �� | �� | �� | 22,253 | �� | �� | �� | 61,628 | �� | �� | 1.1 | �� | �� | �� | 2,316 | �� | �� | 17 | �� |
| Developed land loans | �� | �� | 7,788 | �� | �� | �� | 2 | �� | �� | �� | 7,790 | �� | �� | 0.1 | �� | �� | �� | 556 | �� | �� | 14 | �� |
| Undeveloped land loans | �� | �� | 16,684 | �� | �� | �� | 4,185 | �� | �� | �� | 20,869 | �� | �� | 0.4 | �� | �� | �� | 1,112 | �� | �� | 15 | �� |
| Land development | �� | �� | 5,988 | �� | �� | �� | 4,382 | �� | �� | �� | 10,370 | �� | �� | 0.2 | �� | �� | �� | 665 | �� | �� | 9 | �� |
| Total | �� | $ | 166,551 | �� | �� | $ | 72,476 | �� | �� | $ | 239,027 | �� | �� | 4.2 | % | �� | $ | 2,414 | �� | �� | 69 | �� |
| �� | �� | �� | �� | �� | �� | �� | �� | �� | �� | �� | �� | �� | �� | �� | �� | �� | �� | �� | �� | �� | �� | �� |
Exposure and risk in our construction, land and land development portfolio increased compared to recent periods as indicated in the following table:
| �� | �� | Outstanding Balance as of | ||||||||||||||||||
| (dollars in thousands; unaudited) | �� | March 31, 2025 | �� | December 31, 2024 | �� | September 30, 2024 | �� | June 30, 2024 | �� | March 31, 2024 | ||||||||||
| Commercial construction | �� | $ | 96,716 | �� | �� | $ | 83,216 | �� | �� | $ | 97,792 | �� | �� | $ | 110,372 | �� | �� | $ | 102,099 | �� |
| Residential construction | �� | �� | 39,375 | �� | �� | �� | 40,940 | �� | �� | �� | 35,822 | �� | �� | �� | 34,652 | �� | �� | �� | 28,751 | �� |
| Undeveloped land loans | �� | �� | 16,684 | �� | �� | �� | 8,665 | �� | �� | �� | 8,606 | �� | �� | �� | 8,372 | �� | �� | �� | 8,190 | �� |
| Developed land loans | �� | �� | 7,788 | �� | �� | �� | 8,305 | �� | �� | �� | 14,863 | �� | �� | �� | 13,954 | �� | �� | �� | 14,307 | �� |
| Land development | �� | �� | 5,988 | �� | �� | �� | 7,072 | �� | �� | �� | 5,968 | �� | �� | �� | 5,714 | �� | �� | �� | 7,515 | �� |
| Total | �� | $ | 166,551 | �� | �� | $ | 148,198 | �� | �� | $ | 163,051 | �� | �� | $ | 173,064 | �� | �� | $ | 160,862 | �� |
| �� | �� | �� | �� | �� | �� | �� | �� | �� | �� | �� | �� | �� | �� | �� | �� | �� | �� | �� | �� | �� |
Commitments to extend credit total
The following table presents outstanding commitments to extend credit as of March��31, 2025:
| Consolidated | �� | �� | ||
| (dollars in thousands; unaudited) | �� | As of March 31, 2025 | ||
| Commitments to extend credit: | �� | �� | ||
| Commercial and industrial loans | �� | $ | 86,108 | �� |
| Commercial and industrial loans - capital call lines | �� | �� | 514,864 | �� |
| Construction �� commercial real estate loans | �� | �� | 50,221 | �� |
| Construction �� residential real estate loans | �� | �� | 22,255 | �� |
| Residential real estate loans | �� | �� | 529,335 | �� |
| Commercial real estate loans | �� | �� | 29,401 | �� |
| Credit cards | �� | �� | 868,969 | �� |
| Consumer and other loans | �� | �� | 41,789 | �� |
| Total commitments to extend credit | �� | $ | 2,142,942 | �� |
| �� | �� | �� | �� | �� |
We have individual CCBX partner portfolio limits with our each of our partners to manage loan concentration risk, liquidity risk, and counter-party partner risk. For example, as of March��31, 2025, capital call lines outstanding balance totaled
See the table below for CCBX portfolio maximums and related available commitments:
| CCBX | �� | �� | �� | �� | �� | �� | �� | �� | |||||||||
| (dollars in thousands; unaudited) | �� | Balance | �� | Percent of CCBX loans receivable | Available Commitments (1) | �� | Maximum Portfolio Size | Cash Reserve/Pledge Account Amount (2) | |||||||||
| Commercial and industrial loans: | �� | �� | �� | �� | �� | �� | |||||||||||
| Capital call lines | �� | $ | 133,466 | �� | �� | 8.1 | % | $ | 514,864 | �� | �� | $ | 350,000 | �� | $ | �� | �� |
| All other commercial & industrial loans | �� | �� | 29,702 | �� | �� | 1.8 | �� | �� | 21,736 | �� | �� | �� | 475,720 | �� | �� | 541 | �� |
| AG���˹ٷ� estate loans: | �� | �� | �� | �� | �� | �� | �� | �� | |||||||||
| Home equity lines of credit (3) | �� | �� | 285,355 | �� | �� | 17.3 | �� | �� | 481,778 | �� | �� | �� | 375,000 | �� | �� | 33,436 | �� |
| Consumer and other loans: | �� | �� | �� | �� | �� | �� | |||||||||||
| Credit cards - cash secured | �� | �� | 339 | �� | �� | �� | �� | �� | �� | �� | �� | �� | �� | �� | |||
| Credit cards - unsecured | �� | �� | 532,436 | �� | �� | �� | �� | 868,969 | �� | �� | �� | �� | 27,589 | �� | |||
| Credit cards - total | �� | �� | 532,775 | �� | �� | 32.2 | �� | �� | 868,969 | �� | �� | �� | 850,000 | �� | �� | 27,589 | �� |
| Installment loans - cash secured | �� | �� | 127,426 | �� | �� | �� | �� | 29,027 | �� | �� | �� | �� | �� | �� | |||
| Installment loans - unsecured | �� | �� | 527,418 | �� | �� | �� | �� | �� | �� | �� | �� | �� | 1,175 | �� | |||
| Installment loans - total | �� | �� | 654,844 | �� | �� | 39.7 | �� | �� | 29,027 | �� | �� | �� | 1,814,541 | �� | �� | 1,175 | �� |
| Other consumer and other loans | �� | �� | 15,182 | �� | �� | 0.9 | �� | �� | 2 | �� | �� | �� | 4,739 | �� | �� | 419 | �� |
| Gross CCBX loans receivable | �� | �� | 1,651,324 | �� | �� | 100.0 | % | �� | 1,916,376 | �� | �� | �� | 3,870,000 | �� | $ | 63,160 | �� |
| Net deferred origination fees | �� | �� | (498 | ) | �� | �� | �� | �� | �� | �� | |||||||
| Loans receivable | �� | $ | 1,650,826 | �� | �� | �� | �� | �� | �� | �� | |||||||
| (1) | Remaining commitment available, net of outstanding balance. |
| (2) | Balances are as of April��9, 2025. |
| (3) | These home equity lines of credit are secured by residential real estate and are accessed by using a credit card, but are classified as 1-4 family residential properties per regulatory guidelines. |
| �� | �� |
APPENDIX B -
As of March��31, 2025
CCBX �� BaaS Reporting Information
During the quarter ended March��31, 2025,
The Bank records contractual interest earned from the borrower on CCBX partner loans in interest income, adjusted for origination costs which are paid or payable to the CCBX partner. BaaS loan expense represents the amount paid or payable to partners for credit and fraud enhancements and originating and servicing CCBX loans. To determine net revenue (Net BaaS loan income) earned from CCBX loan relationships, the Bank takes BaaS loan interest income and deducts BaaS loan expense to arrive at Net BaaS loan income (a reconciliation of the non-GAAP measures are set forth in the preceding section of this earnings release) which can be compared to interest income on the Company’s community bank loans.
The following table illustrates how CCBX partner loan income and expenses are recorded in the financial statements:
| Loan income and related loan expense | �� | Three Months Ended | ||||||||||
| (dollars in thousands; unaudited) | �� | March 31, 2025 | �� | December 31, 2024 | �� | March 31, 2024 | ||||||
| Yield on loans (1) | �� | �� | 16.88 | % | �� | �� | 16.81 | % | �� | �� | 17.74 | % |
| BaaS loan interest income | �� | $ | 67,855 | �� | �� | $ | 64,532 | �� | �� | $ | 55,839 | �� |
| Less: BaaS loan expense | �� | �� | 32,507 | �� | �� | �� | 30,720 | �� | �� | �� | 26,107 | �� |
| Net BaaS loan income (2) | �� | $ | 35,348 | �� | �� | $ | 33,812 | �� | �� | $ | 29,732 | �� |
| Net BaaS loan income divided by average BaaS loans (1)(2) | �� | �� | 8.79 | % | �� | �� | 8.81 | % | �� | �� | 9.45 | % |
(1) Annualized calculation for quarterly periods shown.
(2) A reconciliation of the non-GAAP measures are set forth in the preceding section of this earnings release.
An increase in average CCBX loans receivable resulted in increased interest income on CCBX loans during the quarter ended March��31, 2025 compared to the quarter ended December��31, 2024. The increase in average CCBX loans receivable was primarily due to our strategy to optimize the CCBX loan portfolio and strengthen our balance sheet through originating higher quality new loans with enhanced credit standards. These higher quality loans also have lower stated rates and expected losses than some of our CCBX loans historically. Our yield on loans and our net interest margin net of BaaS loan expense slightly increased, as our CCBX portfolio is leveling out. Current loan sales and new loan growth are at more similar interest rates compared to prior periods when we were selling loans with higher risk and higher interest rates and replacing them with higher quality lower interest rate loans. We continue to reposition ourselves by managing CCBX credit and concentration levels in an effort to optimize our loan portfolio and also generate off balance sheet fee income. Growth in CCBX loans and deposits has resulted in increases in interest income and expense for the quarter ended March��31, 2025 compared to the quarter ended March��31, 2024.
The following tables are a summary of the interest components, direct fees and expenses of BaaS for the periods indicated and are not inclusive of all income and expense related to BaaS.
| Interest income | �� | Three Months Ended | ||||||||||
| (dollars in thousands; unaudited) | �� | March 31, 2025 | �� | December 31, 2024 | �� | March 31, 2024 | ||||||
| Loan interest income | �� | $ | 67,855 | �� | �� | $ | 64,532 | �� | �� | $ | 55,839 | �� |
| Total BaaS interest income | �� | $ | 67,855 | �� | �� | $ | 64,532 | �� | �� | $ | 55,839 | �� |
| �� | �� | �� | �� | �� | �� | �� | �� | �� | �� | �� | �� | �� |
| Interest expense | �� | Three Months Ended | ||||||||||
| (dollars in thousands; unaudited) | �� | March 31, 2025 | �� | December 31, 2024 | �� | March 31, 2024 | ||||||
| BaaS interest expense | �� | $ | 21,581 | �� | �� | $ | 22,243 | �� | �� | $ | 22,854 | �� |
| Total BaaS interest expense | �� | $ | 21,581 | �� | �� | $ | 22,243 | �� | �� | $ | 22,854 | �� |
| �� | �� | �� | �� | �� | �� | �� | �� | �� | �� | �� | �� | �� |
| BaaS income | �� | Three Months Ended | ||||||||||
| (dollars in thousands; unaudited) | �� | March 31, 2025 | �� | December 31, 2024 | �� | March 31, 2024 | ||||||
| BaaS program income: | �� | �� | �� | �� | �� | �� | ||||||
| Servicing and other BaaS fees | �� | $ | 1,419 | �� | �� | $ | 1,043 | �� | �� | $ | 1,131 | �� |
| Transaction and interchange fees | �� | �� | 3,833 | �� | �� | �� | 3,699 | �� | �� | �� | 2,661 | �� |
| Reimbursement of expenses | �� | �� | 1,026 | �� | �� | �� | 812 | �� | �� | �� | 254 | �� |
| Total BaaS program income | �� | �� | 6,278 | �� | �� | �� | 5,554 | �� | �� | �� | 4,046 | �� |
| BaaS indemnification income: | �� | �� | �� | �� | �� | �� | ||||||
| BaaS credit enhancements | �� | �� | 53,648 | �� | �� | �� | 62,097 | �� | �� | �� | 79,808 | �� |
| BaaS fraud enhancements | �� | �� | 1,993 | �� | �� | �� | 5,043 | �� | �� | �� | 923 | �� |
| BaaS indemnification income | �� | �� | 55,641 | �� | �� | �� | 67,140 | �� | �� | �� | 80,731 | �� |
| Total noninterest BaaS income | �� | $ | 61,919 | �� | �� | $ | 72,694 | �� | �� | $ | 84,777 | �� |
| �� | �� | �� | �� | �� | �� | �� | �� | �� | �� | �� | �� | �� |
Servicing and other BaaS fees increased
| BaaS loan and fraud expense: | �� | Three Months Ended | ||||||||||
| (dollars in thousands; unaudited) | �� | March 31, 2025 | �� | December 31, 2024 | �� | March 31, 2024 | ||||||
| BaaS loan expense | �� | $ | 32,507 | �� | �� | $ | 30,720 | �� | �� | $ | 26,107 | �� |
| BaaS fraud expense | �� | �� | 1,993 | �� | �� | �� | 5,043 | �� | �� | �� | 923 | �� |
| Total BaaS loan and fraud expense | �� | $ | 34,500 | �� | �� | $ | 35,763 | �� | �� | $ | 27,030 | �� |
| �� | �� | �� | �� | �� | �� | �� | �� | �� | �� | �� | �� | �� |
A photo accompanying this announcement is available at
