Coastal Financial Corporation Announces Second Quarter 2025 Results
Coastal Financial Corporation (NASDAQ: CCB) reported Q2 2025 net income of $11.0 million, or $0.71 per diluted share, compared to $9.7 million in Q1 2025 and $11.6 million in Q2 2024. The company saw improved performance in its Banking as a Service (CCBX) segment, with lower credit loss provisions and an 8.2% increase in program fee income to $6.8 million.
Key highlights include deposit growth of $122.3 million in Q2, with average deposits reaching $3.93 billion. The company sold $1.30 billion of loans, mostly credit card receivables, and maintained strong credit protection with 98.8% indemnification against credit risk. The company has 29 CCBX relationships at various stages, including two partners in testing, two in implementation, and five signed letters of intent.
The efficiency ratio was 60.98%, with ROA at 0.99% for Q2 2025. The company maintains strong capital ratios with a Tier 1 leverage ratio of 10.39% and total risk-based capital of 14.90%.
Coastal Financial Corporation (NASDAQ: CCB) ha riportato un utile netto di 11,0 milioni di dollari nel secondo trimestre del 2025, pari a 0,71 dollari per azione diluita, rispetto a 9,7 milioni di dollari nel primo trimestre 2025 e 11,6 milioni di dollari nel secondo trimestre 2024. L'azienda ha registrato una migliorata performance nel segmento Banking as a Service (CCBX), con minori accantonamenti per perdite su crediti e un aumento dell'8,2% dei ricavi da commissioni di programma, arrivati a 6,8 milioni di dollari.
I punti salienti includono una crescita dei depositi di 122,3 milioni di dollari nel secondo trimestre, con depositi medi che hanno raggiunto i 3,93 miliardi di dollari. La società ha venduto prestiti per 1,30 miliardi di dollari, principalmente crediti da carte di credito, mantenendo una solida protezione del credito con un'indennità del 98,8% contro il rischio di credito. L'azienda conta 29 relazioni CCBX in diverse fasi, tra cui due partner in fase di test, due in fase di implementazione e cinque con lettere di intenti firmate.
Il rapporto di efficienza è stato del 60,98%, con un ROA dello 0,99% per il secondo trimestre 2025. La società mantiene solidi coefficienti patrimoniali con un rapporto di leva Tier 1 del 10,39% e un capitale totale basato sul rischio del 14,90%.
Coastal Financial Corporation (NASDAQ: CCB) reportó un ingreso neto de 11,0 millones de dólares en el segundo trimestre de 2025, o 0,71 dólares por acción diluida, en comparación con 9,7 millones en el primer trimestre de 2025 y 11,6 millones en el segundo trimestre de 2024. La compañía mostró una mejora en el desempeño de su segmento Banking as a Service (CCBX), con menores provisiones por pérdidas crediticias y un aumento del 8,2% en los ingresos por tarifas de programa, alcanzando los 6,8 millones de dólares.
Los aspectos destacados incluyen un crecimiento de depósitos de 122,3 millones de dólares en el segundo trimestre, con depósitos promedio que llegaron a 3,93 mil millones de dólares. La empresa vendió préstamos por 1,30 mil millones de dólares, principalmente cuentas por cobrar de tarjetas de crédito, y mantuvo una fuerte protección crediticia con una indemnización del 98,8% contra el riesgo crediticio. La compañía tiene 29 relaciones CCBX en diversas etapas, incluyendo dos socios en pruebas, dos en implementación y cinco con cartas de intención firmadas.
El índice de eficiencia fue del 60,98%, con un ROA del 0,99% para el segundo trimestre de 2025. La empresa mantiene sólidos índices de capital con un índice de apalancamiento Tier 1 del 10,39% y un capital total basado en riesgos del 14,90%.
Coastal Financial Corporation (NASDAQ: CCB)�� 2025�� 2분기 순이익으�� 1,100�� 달러, 희석 주당 0.71달러�� 보고했으��, 이는 2025�� 1분기�� 970�� 달러와 2024�� 2분기�� 1,160�� 달러와 비교됩니��. 회사�� Banking as a Service (CCBX) 부문의 성과가 개선되어 신용 손실 충당금이 줄고 프로그램 수수�� 수익�� 8.2% 증가하여 680�� 달러�� 달했습니��.
주요 내용으로�� 2분기�� 1�� 2,230�� 달러�� 예금 증가가 있었으며, 평균 예금액은 39�� 3천만 달러�� 달했습니��. 회사�� 주로 신용카드 채권으로 구성�� 13�� 달러�� 대출을 매각했으��, 신용 위험�� 대�� 98.8%�� 보상률을 유지하며 강력�� 신용 보호�� 유지했습니다. 회사�� 테스�� 중인 파트�� 2��, 구현 중인 2��, 의향서에 서명�� 5곳을 포함하여 29개의 CCBX 관���� 다양�� 단계에서 보유하고 있습니다.
효율�� 비율은 60.98%였으며, 2025�� 2분기 ROA�� 0.99%였습니��. 회사�� Tier 1 레버리지 비율 10.39%와 �� 위험 기반 자본 14.90%�� 강력�� 자본 비율�� 유지하고 있습니다.
Coastal Financial Corporation (NASDAQ : CCB) a annoncé un bénéfice net de 11,0 millions de dollars au deuxième trimestre 2025, soit 0,71 dollar par action diluée, contre 9,7 millions au premier trimestre 2025 et 11,6 millions au deuxième trimestre 2024. La société a observé une amélioration des performances dans son segment Banking as a Service (CCBX), avec une réduction des provisions pour pertes sur crédits et une hausse de 8,2 % des revenus liés aux frais de programme, atteignant 6,8 millions de dollars.
Les points clés incluent une croissance des dépôts de 122,3 millions de dollars au deuxième trimestre, avec des dépôts moyens atteignant 3,93 milliards de dollars. La société a vendu 1,30 milliard de dollars de prêts, principalement des créances de cartes de crédit, et a maintenu une forte protection du crédit avec une indemnisation de 98,8 % contre le risque de crédit. L’entreprise compte 29 relations CCBX à différents stades, dont deux partenaires en phase de test, deux en cours de mise en œuvre et cinq lettres d’intention signées.
Le ratio d’efficacité était de 60,98 %, avec un ROA de 0,99 % pour le deuxième trimestre 2025. L’entreprise maintient des ratios de capital solides avec un ratio de levier Tier 1 de 10,39 % et un capital total pondéré en fonction des risques de 14,90 %.
Coastal Financial Corporation (NASDAQ: CCB) meldete für das zweite Quartal 2025 einen Nettogewinn von 11,0 Millionen US-Dollar bzw. 0,71 US-Dollar je verwässerter Aktie, verglichen mit 9,7 Millionen im ersten Quartal 2025 und 11,6 Millionen im zweiten Quartal 2024. Das Unternehmen verzeichnete eine verbesserte Leistung im Bereich Banking as a Service (CCBX), mit geringeren Rückstellungen für Kreditausfälle und einem Anstieg der Programmentgelte um 8,2 % auf 6,8 Millionen US-Dollar.
Wesentliche Highlights sind ein Einlagenwachstum von 122,3 Millionen US-Dollar im zweiten Quartal, wobei die durchschnittlichen Einlagen 3,93 Milliarden US-Dollar erreichten. Das Unternehmen verkaufte Darlehen im Wert von 1,30 Milliarden US-Dollar, überwiegend Kreditkartenforderungen, und behielt einen starken Kreditschutz mit einer Entschädigung von 98,8 % gegen Kreditrisiken bei. Das Unternehmen hat 29 CCBX-Partnerschaften in verschiedenen Stadien, darunter zwei Partner in der Testphase, zwei in der Implementierung und fünf mit unterzeichneten Absichtserklärungen.
Die Effizienzquote lag bei 60,98 %, der ROA bei 0,99 % für das zweite Quartal 2025. Das Unternehmen hält starke Kapitalquoten mit einer Tier-1-Leverage-Quote von 10,39 % und einem Gesamtkapital auf Risikobasis von 14,90 %.
- CCBX program fee income increased 8.2% quarter-over-quarter to $6.8 million
- Strong deposit growth of $122.3 million in Q2 2025
- Net income increased to $11.0 million from $9.7 million in previous quarter
- Lower provision for credit losses due to improved CCBX portfolio performance
- Robust partner protection with 98.8% credit risk indemnification
- Strong capital position with 10.39% Tier 1 leverage ratio
- Efficiency ratio increased to 60.98% from 51.59% in previous quarter
- ROA decreased to 0.99% from 1.21% year-over-year
- Net charge-offs to average loans remained elevated at 5.54%
- Nonperforming assets to total assets increased to 1.36% from 1.30% in previous quarter
- $439,000 loss on equity securities from revaluation of private equity stake
Insights
CCB posts solid Q2 with improved credit metrics, higher earnings despite CCBX transition investments.
Coastal Financial Corporation posted net income of $11.0 million ($0.71/share) for Q2 2025, showing an improvement from $9.7 million ($0.63/share) in Q1 2025, though down from $11.6 million ($0.84/share) in Q2 2024. The quarterly sequential improvement of 13.3% signals positive momentum despite year-over-year pressure.
The standout narrative this quarter revolves around credit quality improvements in their Banking-as-a-Service (CCBX) portfolio. The provision for credit losses decreased significantly to $32.2 million from $55.8 million in Q1 2025 �� a 42.3% reduction that directly boosted bottom-line results. This improvement stems from their strategic shift toward higher-quality CCBX loans and stronger indemnification arrangements, with 98.8% of CCBX loans protected against credit risk.
On the deposit front, CCB achieved $122.3 million in growth during Q2, with average deposits reaching $3.93 billion (up 6.0% quarter-over-quarter). This deposit strength gives the bank flexibility in managing its funding costs, which remained relatively stable at 3.10% compared to 3.08% in Q1.
Their CCBX segment continues showing promise with core program fee income (excluding nonrecurring revenue) increasing 8.2% quarter-over-quarter to $6.8 million. The pipeline includes two partners in testing, two in implementation, and five signed LOIs �� suggesting continued growth potential.
Management has signaled expense growth should moderate in H2 2025 as upfront investments in compliance, technology, and risk management for new CCBX partnerships begin generating revenue. Current noninterest expenses of $72.8 million were up just 1.2% from Q1, showing disciplined cost management despite growth investments.
The improved asset quality metrics are particularly noteworthy, with the allowance for credit losses to total loans decreasing to 4.65% from 5.21% quarter-over-quarter, while maintaining strong coverage at 270.7% of nonperforming loans. Capital ratios remain robust with a CET1 ratio of 12.32%, providing significant headroom above regulatory requirements.
EVERETT, Wash., July 29, 2025 (GLOBE NEWSWIRE) -- Coastal Financial Corporation (Nasdaq: CCB) (the “Company��, "Coastal", "we", "our", or "us"), the holding company for Coastal Community Bank (the “Bank��), through which it operates a community-focused bank segment ("community bank") with an industry leading banking as a service ("BaaS") segment ("CCBX"), today reported unaudited financial results for the quarter ended June��30, 2025, including net income of
Management Discussion of the Second Quarter Results
“Second quarter of 2025 saw a lower provision for credit losses as a result of an improvement in the performance of the CCBX portfolio and our focus on originating higher quality CCBX loans resulting in lower historical loss factors. Noninterest expenses were fairly flat compared to last quarter related to continued onboarding and implementation costs for partnerships and products within CCBX and investments in technology. We believe these investments are important to the long-term success and scalability of the Company,�� stated CEO Eric Sprink. “We had another quarter of quality deposit growth of
Key Points for Second Quarter and Our Go-Forward Strategy
- CCBX Making Progress on Launching New Programs. As of June��30, 2025 we had two partners in testing, two in implementation/onboarding, five signed letters of intent (LOI) and we have an active pipeline of new partners along with new products with existing partners for the balance of 2025 and into 2026. Total BaaS program fee income was
$6.8 million , excluding$504,000 in nonrecurring revenue, for the three months ended June��30, 2025, an increase of$512,000 , or8.2% , from the three months ended March��31, 2025. We continue to have contracts with our partners that fully indemnify us against fraud and98.8% against credit risk as of June��30, 2025. - Continued Investments in Future Growth. Total noninterest expense of
$72.8 million was up$843,000 , or1.2% , as compared to$72.0 million in the quarter ended March��31, 2025, mainly driven by higher data processing and software costs partially offset by lower legal and professional expenses. With the increase in new CCBX partners and the launch of products with existing partners in 2025, we expect that expenses will be predominantly incurred at the outset, emphasizing compliance and operational risk management. This will occur before the new programs or products start to produce revenue. As a result, we believe expense growth should moderate considerably in the second half of 2025, with new programs or products starting to produce revenue to offset the initial up-front expenses. - Favorable Trends On, and Off Balance Sheet. Average deposits were
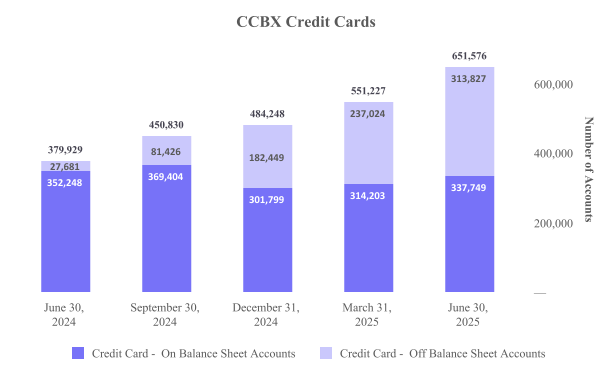
$3.93 billion , an increase of$221.6 million , or6.0% , over the quarter ended March��31, 2025, driven primarily by growth in CCBX partner programs and the addition of a new deposit partner. During the second quarter of 2025, we sold$1.30 billion of loans, the majority of which were credit card receivables. We retain a portion of the fee income on sold credit card loans. As of June��30, 2025 there were 313,827 off balance sheet credit cards with fee earning potential, an increase of 76,803 compared to the quarter ended March��31, 2025 and an increase of 286,146 from June��30, 2024.
Second Quarter 2025 Financial Highlights
The tables below outline some of our key operating metrics.
| �� | Three Months Ended | ||||||||||||||||||
| (Dollars in thousands, except share and per share data; unaudited) | June 30, 2025 | �� | March 31, 2025 | �� | December 31, 2024 | �� | September 30, 2024 | �� | June 30, 2024 | ||||||||||
| Income Statement Data: | �� | �� | �� | �� | �� | �� | �� | �� | �� | ||||||||||
| Interest and dividend income | $ | 107,797 | �� | �� | $ | 104,907 | �� | �� | $ | 102,448 | �� | �� | $ | 105,165 | �� | �� | $ | 97,422 | �� |
| Interest expense | �� | 31,060 | �� | �� | �� | 28,845 | �� | �� | �� | 30,071 | �� | �� | �� | 32,892 | �� | �� | �� | 31,250 | �� |
| Net interest income | �� | 76,737 | �� | �� | �� | 76,062 | �� | �� | �� | 72,377 | �� | �� | �� | 72,273 | �� | �� | �� | 66,172 | �� |
| Provision for credit losses | �� | 32,211 | �� | �� | �� | 55,781 | �� | �� | �� | 61,867 | �� | �� | �� | 70,257 | �� | �� | �� | 62,325 | �� |
| Net interest income after provision for credit losses | �� | 44,526 | �� | �� | �� | 20,281 | �� | �� | �� | 10,510 | �� | �� | �� | 2,016 | �� | �� | �� | 3,847 | �� |
| Noninterest income | �� | 42,693 | �� | �� | �� | 63,477 | �� | �� | �� | 74,100 | �� | �� | �� | 78,790 | �� | �� | �� | 69,138 | �� |
| Noninterest expense | �� | 72,832 | �� | �� | �� | 71,989 | �� | �� | �� | 67,411 | �� | �� | �� | 64,424 | �� | �� | �� | 57,964 | �� |
| Provision for income tax | �� | 3,359 | �� | �� | �� | 2,039 | �� | �� | �� | 3,832 | �� | �� | �� | 2,926 | �� | �� | �� | 3,425 | �� |
| Net income | $ | 11,028 | �� | �� | $ | 9,730 | �� | �� | $ | 13,367 | �� | �� | $ | 13,456 | �� | �� | $ | 11,596 | �� |
| �� | �� | �� | �� | �� | �� | �� | �� | �� | �� | ||||||||||
| �� | As of and for the Three Month Period | ||||||||||||||||||
| �� | June 30, 2025 | �� | March 31, 2025 | �� | December 31, 2024 | �� | September 30, 2024 | �� | June 30, 2024 | ||||||||||
| Balance Sheet Data: | �� | �� | �� | �� | �� | �� | �� | �� | �� | ||||||||||
| Cash and cash equivalents | $ | 719,759 | �� | �� | $ | 624,302 | �� | �� | $ | 452,513 | �� | �� | $ | 484,026 | �� | �� | $ | 487,245 | �� |
| Investment securities | �� | 45,577 | �� | �� | �� | 46,991 | �� | �� | �� | 47,321 | �� | �� | �� | 48,620 | �� | �� | �� | 49,213 | �� |
| Loans held for sale | �� | 60,474 | �� | �� | �� | 42,132 | �� | �� | �� | 20,600 | �� | �� | �� | 7,565 | �� | �� | �� | �� | �� |
| Loans receivable | �� | 3,540,330 | �� | �� | �� | 3,517,359 | �� | �� | �� | 3,486,565 | �� | �� | �� | 3,413,894 | �� | �� | �� | 3,321,813 | �� |
| Allowance for credit losses | �� | (164,794 | ) | �� | �� | (183,178 | ) | �� | �� | (176,994 | ) | �� | �� | (171,674 | ) | �� | �� | (148,878 | ) |
| Total assets | �� | 4,480,559 | �� | �� | �� | 4,339,282 | �� | �� | �� | 4,121,208 | �� | �� | �� | 4,064,472 | �� | �� | �� | 3,959,549 | �� |
| Interest bearing deposits | �� | 3,358,216 | �� | �� | �� | 3,251,599 | �� | �� | �� | 3,057,808 | �� | �� | �� | 3,047,861 | �� | �� | �� | 2,949,643 | �� |
| Noninterest bearing deposits | �� | 555,355 | �� | �� | �� | 539,630 | �� | �� | �� | 527,524 | �� | �� | �� | 579,427 | �� | �� | �� | 593,789 | �� |
| Core deposits (1) | �� | 3,441,624 | �� | �� | �� | 3,321,772 | �� | �� | �� | 3,123,434 | �� | �� | �� | 3,190,869 | �� | �� | �� | 3,528,339 | �� |
| Total deposits | �� | 3,913,571 | �� | �� | �� | 3,791,229 | �� | �� | �� | 3,585,332 | �� | �� | �� | 3,627,288 | �� | �� | �� | 3,543,432 | �� |
| Total borrowings | �� | 47,960 | �� | �� | �� | 47,923 | �� | �� | �� | 47,884 | �� | �� | �� | 47,847 | �� | �� | �� | 47,810 | �� |
| Total shareholders�� equity | $ | 461,709 | �� | �� | $ | 449,917 | �� | �� | $ | 438,704 | �� | �� | $ | 331,930 | �� | �� | $ | 316,693 | �� |
| �� | �� | �� | �� | �� | �� | �� | �� | �� | �� | ||||||||||
| Share and Per Share Data (2): | �� | �� | �� | �� | �� | �� | �� | �� | �� | ||||||||||
| Earnings per share �� basic | $ | 0.73 | �� | �� | $ | 0.65 | �� | �� | $ | 0.97 | �� | �� | $ | 1.00 | �� | �� | $ | 0.86 | �� |
| Earnings per share �� diluted | $ | 0.71 | �� | �� | $ | 0.63 | �� | �� | $ | 0.94 | �� | �� | $ | 0.97 | �� | �� | $ | 0.84 | �� |
| Dividends per share | �� | �� | �� | �� | �� | �� | �� | �� | �� | �� | �� | �� | �� | �� | �� | �� | �� | �� | �� |
| Book value per share (3) | $ | 30.59 | �� | �� | $ | 29.98 | �� | �� | $ | 29.37 | �� | �� | $ | 24.51 | �� | �� | $ | 23.54 | �� |
| Tangible book value per share (4) | $ | 30.59 | �� | �� | $ | 29.98 | �� | �� | $ | 29.37 | �� | �� | $ | 24.51 | �� | �� | $ | 23.54 | �� |
| Weighted avg outstanding shares �� basic | �� | 15,033,296 | �� | �� | �� | 14,962,507 | �� | �� | �� | 13,828,605 | �� | �� | �� | 13,447,066 | �� | �� | �� | 13,412,667 | �� |
| Weighted avg outstanding shares �� diluted | �� | 15,447,923 | �� | �� | �� | 15,462,041 | �� | �� | �� | 14,268,229 | �� | �� | �� | 13,822,270 | �� | �� | �� | 13,736,508 | �� |
| Shares outstanding at end of period | �� | 15,093,036 | �� | �� | �� | 15,009,225 | �� | �� | �� | 14,935,298 | �� | �� | �� | 13,543,282 | �� | �� | �� | 13,453,805 | �� |
| Stock options outstanding at end of period | �� | 126,654 | �� | �� | �� | 163,932 | �� | �� | �� | 186,354 | �� | �� | �� | 198,370 | �� | �� | �� | 286,119 | �� |
| �� | �� | �� | �� | �� | �� | �� | �� | �� | �� | �� | �� | �� | �� | �� | �� | �� | �� | �� | �� |
See footnotes that follow the tables below
| �� | As of and for the Three Month Period | ||||||||||||||||||
| �� | June 30, 2025 | �� | March 31, 2025 | �� | December 31, 2024 | �� | September 30, 2024 | �� | June 30, 2024 | ||||||||||
| Credit Quality Data: | �� | �� | �� | �� | �� | �� | �� | �� | �� | ||||||||||
| Nonperforming assets (5) to total assets | �� | 1.36 | % | �� | �� | 1.30 | % | �� | �� | 1.52 | % | �� | �� | 1.63 | % | �� | �� | 1.34 | % |
| Nonperforming assets (5) to loans receivable and OREO | �� | 1.72 | % | �� | �� | 1.60 | % | �� | �� | 1.80 | % | �� | �� | 1.94 | % | �� | �� | 1.60 | % |
| Nonperforming loans (5) to total loans receivable | �� | 1.72 | % | �� | �� | 1.60 | % | �� | �� | 1.80 | % | �� | �� | 1.94 | % | �� | �� | 1.60 | % |
| Allowance for credit losses to nonperforming loans | �� | 270.7 | % | �� | �� | 325.0 | % | �� | �� | 282.5 | % | �� | �� | 258.7 | % | �� | �� | 279.9 | % |
| Allowance for credit losses to total loans receivable | �� | 4.65 | % | �� | �� | 5.21 | % | �� | �� | 5.08 | % | �� | �� | 5.03 | % | �� | �� | 4.48 | % |
| Gross charge-offs | $ | 53,780 | �� | �� | $ | 53,686 | �� | �� | $ | 61,585 | �� | �� | $ | 53,305 | �� | �� | $ | 55,207 | �� |
| Gross recoveries | $ | 4,467 | �� | �� | $ | 5,486 | �� | �� | $ | 5,223 | �� | �� | $ | 4,516 | �� | �� | $ | 2,254 | �� |
| Net charge-offs to average loans (6) | �� | 5.54 | % | �� | �� | 5.57 | % | �� | �� | 6.56 | % | �� | �� | 5.60 | % | �� | �� | 6.54 | % |
| �� | �� | �� | �� | �� | �� | �� | �� | �� | �� | ||||||||||
| Capital Ratios: | �� | �� | �� | �� | �� | �� | �� | �� | �� | ||||||||||
| Company | �� | �� | �� | �� | �� | �� | �� | �� | �� | ||||||||||
| Tier 1 leverage capital | �� | 10.39 | % | �� | �� | 10.67 | % | �� | �� | 10.78 | % | �� | �� | 8.40 | % | �� | �� | 8.31 | % |
| Common equity Tier 1 risk-based capital | �� | 12.32 | % | �� | �� | 12.13 | % | �� | �� | 12.04 | % | �� | �� | 9.24 | % | �� | �� | 9.03 | % |
| Tier 1 risk-based capital | �� | 12.41 | % | �� | �� | 12.22 | % | �� | �� | 12.14 | % | �� | �� | 9.34 | % | �� | �� | 9.13 | % |
| Total risk-based capital | �� | 14.90 | % | �� | �� | 14.73 | % | �� | �� | 14.67 | % | �� | �� | 11.89 | % | �� | �� | 11.70 | % |
| Bank | �� | �� | �� | �� | �� | �� | �� | �� | �� | ||||||||||
| Tier 1 leverage capital | �� | 10.33 | % | �� | �� | 10.57 | % | �� | �� | 10.64 | % | �� | �� | 9.29 | % | �� | �� | 9.24 | % |
| Common equity Tier 1 risk-based capital | �� | 12.36 | % | �� | �� | 12.12 | % | �� | �� | 11.99 | % | �� | �� | 10.34 | % | �� | �� | 10.15 | % |
| Tier 1 risk-based capital | �� | 12.36 | % | �� | �� | 12.12 | % | �� | �� | 11.99 | % | �� | �� | 10.34 | % | �� | �� | 10.15 | % |
| Total risk-based capital | �� | 13.65 | % | �� | �� | 13.42 | % | �� | �� | 13.28 | % | �� | �� | 11.63 | % | �� | �� | 11.44 | % |
| �� | |||||||||||||||||||
| (1)��Core deposits are defined as all deposits excluding brokered and time deposits. | |||||||||||||||||||
| (2)��Share and per share amounts are based on total actual or average common shares outstanding, as applicable. | |||||||||||||||||||
| (3)��We calculate book value per share as total shareholders�� equity at the end of the relevant period divided by the outstanding number of our common shares at the end of each period. | |||||||||||||||||||
| (4)��Tangible book value per share is a non-GAAP financial measure. We calculate tangible book value per share as total shareholders�� equity at the end of the relevant period, less goodwill and other intangible assets, divided by the outstanding number of our common shares at the end of each period. The most directly comparable GAAP financial measure is book value per share. We had no goodwill or other intangible assets as of any of the dates indicated. As a result, tangible book value per share is the same as book value per share as of each of the dates indicated. | |||||||||||||||||||
| (5)��Nonperforming assets and nonperforming loans include loans 90+ days past due and accruing interest. | |||||||||||||||||||
| (6)��Annualized calculations. | |||||||||||||||||||
| �� | |||||||||||||||||||
Key Performance Ratios
Return on average assets ("ROA") was
Yield on earning assets and yield on loans receivable decreased
The quarter over quarter volatility in the efficiency ratio and noninterest income to average asset performance metrics was driven by a higher-quality CCBX loan-mix from a credit quality perspective, which effectively reduced the credit enhancement required within non-interest income due to lower net-charge off activity as a percent of total loans which lowered our provision expense. These items have a neutral impact to net income although impacted the quarter-to-quarter metrics due to lower reported noninterest income. Additionally, results for the three months ended June��30, 2025 also included a net
The following table shows the Company’s key performance ratios for the periods indicated.����
| �� | �� | Three Months Ended | |||||||||||||
| (unaudited) | �� | June 30, 2025 | �� | March 31, 2025 | �� | December 31, 2024 | �� | September 30, 2024 | �� | June 30, 2024 | |||||
| �� | �� | �� | �� | �� | �� | �� | �� | �� | �� | �� | |||||
| Return on average assets (1) | �� | 0.99 | % | �� | 0.93 | % | �� | 1.30 | % | �� | 1.34 | % | �� | 1.21 | % |
| Return on average equity (1) | �� | 9.72 | % | �� | 8.91 | % | �� | 14.90 | % | �� | 16.67 | % | �� | 15.22 | % |
| Yield on earnings assets (1) | �� | 9.92 | % | �� | 10.32 | % | �� | 10.24 | % | �� | 10.79 | % | �� | 10.49 | % |
| Yield on loans receivable (1) | �� | 11.11 | % | �� | 11.33 | % | �� | 11.12 | % | �� | 11.44 | % | �� | 11.22 | % |
| Cost of funds (1) | �� | 3.13 | % | �� | 3.11 | % | �� | 3.24 | % | �� | 3.62 | % | �� | 3.60 | % |
| Cost of deposits (1) | �� | 3.10 | % | �� | 3.08 | % | �� | 3.21 | % | �� | 3.59 | % | �� | 3.58 | % |
| Net interest margin (1) | �� | 7.06 | % | �� | 7.48 | % | �� | 7.23 | % | �� | 7.42 | % | �� | 7.12 | % |
| Noninterest expense to average assets (1) | �� | 6.52 | % | �� | 6.87 | % | �� | 6.54 | % | �� | 6.42 | % | �� | 6.05 | % |
| Noninterest income to average assets (1) | �� | 3.82 | % | �� | 6.06 | % | �� | 7.19 | % | �� | 7.85 | % | �� | 7.22 | % |
| Efficiency ratio | �� | 60.98 | % | �� | 51.59 | % | �� | 46.02 | % | �� | 42.65 | % | �� | 42.84 | % |
| Loans receivable to deposits (2) | �� | 92.01 | % | �� | 93.89 | % | �� | 97.82 | % | �� | 94.33 | % | �� | 93.75 | % |
| �� | |||||||||||||||
| (1)��Annualized calculations shown for quarterly periods presented. | |||||||||||||||
| (2)��Includes loans held for sale. | |||||||||||||||
| �� | |||||||||||||||
Management Outlook; CEO Eric Sprink
“As we look to the latter half of 2025 and beyond, we expect to see additional new partner engagements, given that our CCBX pipeline remains strong with high-quality opportunities. We are committed to continuing to invest in our technology and risk management infrastructure to support our growth in the BaaS sector which is expected to produce future efficiencies, automation and cost reductions as we grow. The improvement in the performance of the CCBX portfolio and lower historical loss factors within the CCBX portfolio are positive indicators that our risk reduction and credit improvement efforts are proving effective, alongside the fraud and credit indemnifications provided by our partners. Additionally, we saw an increase of
Coastal Financial Corporation Overview
The Company has one main subsidiary, the Bank, which consists of three segments: CCBX, the community bank and treasury & administration.����The CCBX segment includes all of our BaaS activities, the community bank segment includes all community banking activities and the treasury & administration segment includes treasury management, overall administration and all other aspects of the Company.����
CCBX Performance Update
Our CCBX segment continues to evolve, and we have 29 relationships, at varying stages, including two partners in testing, two in implementation/onboarding, and five signed LOI as of June��30, 2025.�� We continue to refine the criteria for CCBX partnerships, exploring relationships with larger and more established partners, with experienced management teams, existing customer bases and strong financial positions. We also will consider promising medium and smaller sized partners that align with our approach and terms including financial wherewithal and will continue to exit relationships where it makes sense for us to do so.
While we explore relationships with new partners we continue to expand our product offerings with existing CCBX partners. As we become more proficient in the BaaS space we aim to cultivate new relationships that align with our long-term goals. We believe that a strategy of adding new partnerships and launching new products with existing partners allows us to expand and grow our customer base with a modest increase in regulatory risk given our operational history with them. Increases in partner activity/transaction counts is positively impacting noninterest income and we expect this trend to continue as current products grow and new products are introduced. We plan to continue selling loans as part of our strategy to balance partner and lending limits, and manage the loan portfolio and credit quality. We retain a portion of the fee income for our role in processing transactions on sold credit card loans, and will continue this strategy to provide an on-going revenue source with no on balance sheet risk or capital requirement.
As we build our deposit base, we will be able to sweep deposits off and on the balance sheet as needed. This deposit sweep capability allows us to better manage liquidity and deposit programs. At June��30, 2025 we swept off
The following table illustrates the activity and evolution in CCBX relationships for the periods presented.
| �� | As of | ||
| (unaudited) | June 30, 2025 | March 31, 2025 | June 30, 2024 |
| Active | 20 | 19 | 19 |
| Friends and family / testing | 2 | 2 | 1 |
| Implementation / onboarding | 2 | 3 | 1 |
| Signed letters of intent | 5 | 1 | 0 |
| Total CCBX relationships | 29 | 25 | 21 |
| �� | |||
CCBX loans increased
The following table details the CCBX loan portfolio:
| CCBX | �� | As of | |||||||||||||||||||
| �� | �� | June 30, 2025 | �� | March 31, 2025 | �� | June 30, 2024 | |||||||||||||||
| (dollars in thousands; unaudited) | �� | Balance | �� | % to Total | �� | Balance | �� | % to Total | �� | Balance | �� | % to Total | |||||||||
| Commercial and industrial loans: | �� | �� | �� | �� | �� | �� | �� | �� | �� | �� | �� | �� | |||||||||
| Capital call lines | �� | $ | 199,675 | �� | �� | 11.9 | % | �� | $ | 133,466 | �� | �� | 8.1 | % | �� | $ | 109,133 | �� | �� | 7.7 | % |
| All other commercial & industrial loans | �� | �� | 26,142 | �� | �� | 1.6 | �� | �� | �� | 29,702 | �� | �� | 1.8 | �� | �� | �� | 41,757 | �� | �� | 3.0 | �� |
| AG���˹ٷ� estate loans: | �� | �� | �� | �� | �� | �� | �� | �� | �� | �� | �� | �� | |||||||||
| Residential real estate loans | �� | �� | 234,786 | �� | �� | 14.0 | �� | �� | �� | 285,355 | �� | �� | 17.3 | �� | �� | �� | 287,950 | �� | �� | 20.4 | �� |
| Consumer and other loans: | �� | �� | �� | �� | �� | �� | �� | �� | �� | �� | �� | �� | |||||||||
| Credit cards | �� | �� | 533,925 | �� | �� | 31.8 | �� | �� | �� | 532,775 | �� | �� | 32.2 | �� | �� | �� | 549,241 | �� | �� | 39.0 | �� |
| Other consumer and other loans | �� | �� | 686,321 | �� | �� | 40.7 | �� | �� | �� | 670,026 | �� | �� | 40.6 | �� | �� | �� | 422,136 | �� | �� | 29.9 | �� |
| Gross CCBX loans receivable | �� | �� | 1,680,849 | �� | �� | 100.0 | % | �� | �� | 1,651,324 | �� | �� | 100.0 | % | �� | �� | 1,410,217 | �� | �� | 100.0 | % |
| Net deferred origination (fees) costs | �� | �� | (569 | ) | �� | �� | �� | �� | (498 | ) | �� | �� | �� | �� | (438 | ) | �� | �� | |||
| Loans receivable | �� | $ | 1,680,280 | �� | �� | �� | �� | $ | 1,650,826 | �� | �� | �� | �� | $ | 1,409,779 | �� | �� | �� | |||
| Loan Yield - CCBX (1)(2) | �� | �� | 16.22 | % | �� | �� | �� | �� | 16.88 | % | �� | �� | �� | �� | 17.75 | % | �� | �� | |||
| �� | |||||||||||||||||||||
| (1)��CCBX yield does not include the impact of BaaS loan expense.����BaaS loan expense represents the amount paid or payable to partners for credit enhancements and originating & servicing CCBX loans. See reconciliation of the non-GAAP measures at the end of this earnings release for the impact of BaaS loan expense on CCBX loan yield. | |||||||||||||||||||||
| (2)��Loan yield is annualized for the three months ended for each period presented and includes loans held for sale and nonaccrual loans. | |||||||||||||||||||||
| �� | |||||||||||||||||||||
The increase in CCBX loans in the quarter ended June��30, 2025, includes an increase of
The following chart shows the growth in credit card accounts that generate fee income. This includes accounts with balances, which are included in our loan totals, and accounts that have been sold and have no corresponding balance in our loan totals, and that generate fee income.
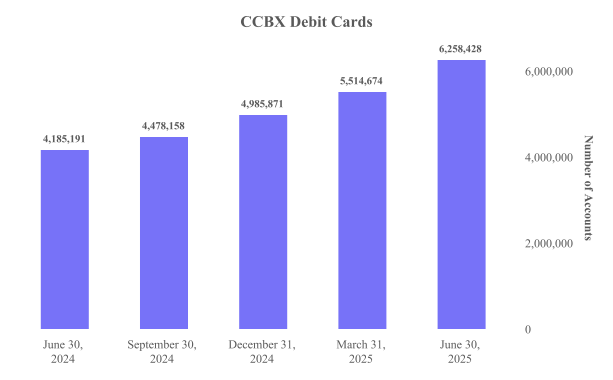
The following chart shows the growth in active CCBX debit cards which are sources of interchange income.
The following table details the CCBX deposit portfolio:
| CCBX | �� | As of | |||||||||||||||||||
| �� | �� | June 30, 2025 | �� | March 31, 2025 | �� | June 30, 2024 | |||||||||||||||
| (dollars in thousands; unaudited) | �� | Balance | �� | % to Total | �� | Balance | �� | % to Total | �� | Balance | �� | % to Total | |||||||||
| Demand, noninterest bearing | �� | $ | 60,448 | �� | �� | 2.6 | % | �� | $ | 58,416 | �� | �� | 2.6 | % | �� | $ | 62,234 | �� | �� | 3.0 | % |
| Interest bearing demand and money market | �� | �� | 2,231,159 | �� | �� | 94.5 | �� | �� | �� | 2,145,608 | �� | �� | 94.6 | �� | �� | �� | 1,989,105 | �� | �� | 96.7 | �� |
| Savings | �� | �� | 51,523 | �� | �� | 2.2 | �� | �� | �� | 16,625 | �� | �� | 0.7 | �� | �� | �� | 5,150 | �� | �� | 0.3 | �� |
| Total core deposits | �� | �� | 2,343,130 | �� | �� | 99.3 | �� | �� | �� | 2,220,649 | �� | �� | 97.9 | �� | �� | �� | 2,056,489 | �� | �� | 100.0 | �� |
| Other deposits | �� | �� | 17,013 | �� | �� | 0.7 | �� | �� | �� | 46,359 | �� | �� | 2.1 | �� | �� | �� | �� | �� | �� | �� | �� |
| Total CCBX deposits | �� | $ | 2,360,143 | �� | �� | 100.0 | % | �� | $ | 2,267,008 | �� | �� | 100.0 | % | �� | $ | 2,056,489 | �� | �� | 100.0 | % |
| Cost of deposits (1) | �� | �� | 3.96 | % | �� | �� | �� | �� | 4.01 | % | �� | �� | �� | �� | 4.92 | % | �� | �� | |||
| �� | |||||||||||||||||||||
| (1)��Cost of deposits is annualized for the three months ended for each period presented. | |||||||||||||||||||||
| �� | |||||||||||||||||||||
CCBX deposits increased
Community Bank Performance Update
In the quarter ended June��30, 2025, the community bank saw net loans decrease
The following table details the Community Bank loan portfolio:
| Community Bank | �� | As of | |||||||||||||||||||
| �� | �� | June 30, 2025 | �� | March 31, 2025 | �� | June 30, 2024 | |||||||||||||||
| (dollars in thousands; unaudited) | �� | Balance | �� | % to Total | �� | Balance | �� | % to Total | �� | Balance | �� | % to Total | |||||||||
| Commercial and industrial loans | �� | $ | 149,926 | �� | �� | 8.0 | % | �� | $ | 149,104 | �� | �� | 8.0 | % | �� | $ | 144,436 | �� | �� | 7.5 | % |
| AG���˹ٷ� estate loans: | �� | �� | �� | �� | �� | �� | �� | �� | �� | �� | �� | �� | |||||||||
| Construction, land and land development loans | �� | �� | 194,150 | �� | �� | 10.4 | �� | �� | �� | 166,551 | �� | �� | 8.9 | �� | �� | �� | 173,064 | �� | �� | 9.0 | �� |
| Residential real estate loans | �� | �� | 198,844 | �� | �� | 10.7 | �� | �� | �� | 202,920 | �� | �� | 10.8 | �� | �� | �� | 229,639 | �� | �� | 12.0 | �� |
| Commercial real estate loans | �� | �� | 1,310,882 | �� | �� | 70.2 | �� | �� | �� | 1,340,647 | �� | �� | 71.6 | �� | �� | �� | 1,357,979 | �� | �� | 70.8 | �� |
| Consumer and other loans: | �� | �� | �� | �� | �� | �� | �� | �� | �� | �� | �� | �� | |||||||||
| Other consumer and other loans | �� | �� | 12,230 | �� | �� | 0.7 | �� | �� | �� | 13,326 | �� | �� | 0.7 | �� | �� | �� | 14,220 | �� | �� | 0.7 | �� |
| Gross Community Bank loans receivable | �� | �� | 1,866,032 | �� | �� | 100.0 | % | �� | �� | 1,872,548 | �� | �� | 100.0 | % | �� | �� | 1,919,338 | �� | �� | 100.0 | % |
| Net deferred origination fees | �� | �� | (5,982 | ) | �� | �� | �� | �� | (6,015 | ) | �� | �� | �� | �� | (7,304 | ) | �� | �� | |||
| Loans receivable | �� | $ | 1,860,050 | �� | �� | �� | �� | $ | 1,866,533 | �� | �� | �� | �� | $ | 1,912,034 | �� | �� | �� | |||
| Loan Yield(1) | �� | �� | 6.53 | % | �� | �� | �� | �� | 6.53 | % | �� | �� | �� | �� | 6.52 | % | �� | �� | |||
| �� | |||||||||||||||||||||
| (1)��Loan yield is annualized for the three months ended for each period presented and includes loans held for sale and nonaccrual loans. | |||||||||||||||||||||
| �� | |||||||||||||||||||||
Community bank loan categories decreased
The following table details the community bank deposit portfolio:
| Community Bank | �� | As of | |||||||||||||||||||
| �� | �� | June 30, 2025 | �� | March 31, 2025 | �� | June 30, 2024 | |||||||||||||||
| (dollars in thousands; unaudited) | �� | Balance | �� | % to Total | �� | Balance | �� | % to Total | �� | Balance | �� | % to Total | |||||||||
| Demand, noninterest bearing | �� | $ | 494,907 | �� | �� | 31.9 | % | �� | $ | 481,214 | �� | �� | 31.5 | % | �� | $ | 531,555 | �� | �� | 35.7 | % |
| Interest bearing demand and money market | �� | �� | 545,655 | �� | �� | 35.1 | �� | �� | �� | 560,416 | �� | �� | 36.8 | �� | �� | �� | 876,668 | �� | �� | 59.0 | �� |
| Savings | �� | �� | 57,933 | �� | �� | 3.7 | �� | �� | �� | 59,493 | �� | �� | 3.9 | �� | �� | �� | 63,627 | �� | �� | 4.3 | �� |
| Total core deposits | �� | �� | 1,098,495 | �� | �� | 70.7 | �� | �� | �� | 1,101,123 | �� | �� | 72.2 | �� | �� | �� | 1,471,850 | �� | �� | 99.0 | �� |
| Other deposits | �� | �� | 440,975 | �� | �� | 28.4 | �� | �� | �� | 407,391 | �� | �� | 26.7 | �� | �� | �� | 1 | �� | �� | 0.0 | �� |
| Time deposits less than | �� | �� | 5,299 | �� | �� | 0.3 | �� | �� | �� | 5,585 | �� | �� | 0.4 | �� | �� | �� | 6,741 | �� | �� | 0.5 | �� |
| Time deposits | �� | �� | 8,659 | �� | �� | 0.6 | �� | �� | �� | 10,122 | �� | �� | 0.7 | �� | �� | �� | 8,351 | �� | �� | 0.5 | �� |
| Total Community Bank deposits | �� | $ | 1,553,428 | �� | �� | 100.0 | % | �� | $ | 1,524,221 | �� | �� | 100.0 | % | �� | $ | 1,486,943 | �� | �� | 100.0 | % |
| Cost of deposits(1) | �� | �� | 1.77 | % | �� | �� | �� | �� | 1.76 | % | �� | �� | �� | �� | 1.77 | % | �� | �� | |||
| �� | |||||||||||||||||||||
| (1)����Cost of deposits is annualized for the three months ended for each period presented. | |||||||||||||||||||||
| �� | |||||||||||||||||||||
Community bank deposits increased
Net Interest Income and Margin Discussion
Net interest income was
Net interest margin was
Interest and fees on loans receivable increased
The following tables illustrate how net interest margin and loan yield is affected by BaaS loan expense:
| Consolidated | �� | As of and for the Three Months Ended | ||||||||||
| (dollars in thousands; unaudited) | �� | June 30 2025 | �� | March 31 2025 | �� | June 30 2024 | ||||||
| Net interest margin, net of BaaS loan expense: | �� | �� | �� | �� | ||||||||
| Net interest margin (1) | �� | �� | 7.06 | % | �� | �� | 7.48 | % | �� | �� | 7.12 | % |
| Earning assets | �� | �� | 4,356,591 | �� | �� | �� | 4,124,065 | �� | �� | �� | 3,736,579 | �� |
| Net interest income (GAAP) | �� | �� | 76,737 | �� | �� | �� | 76,062 | �� | �� | �� | 66,172 | �� |
| Less: BaaS loan expense | �� | �� | (32,483 | ) | �� | �� | (32,507 | ) | �� | �� | (29,011 | ) |
| Net interest income, net of BaaS loan expense(2) | �� | $ | 44,254 | �� | �� | $ | 43,555 | �� | �� | $ | 37,161 | �� |
| Net interest margin, net of BaaS loan expense (1)(2) | �� | �� | 4.07 | % | �� | �� | 4.28 | % | �� | �� | 4.00 | % |
| Loan income net of BaaS loan expense divided by average loans: | �� | �� | ||||||||||
| Loan yield (GAAP)(1) | �� | �� | 11.11 | % | �� | �� | 11.33 | % | �� | �� | 11.22 | % |
| Total average loans receivable | �� | $ | 3,567,823 | �� | �� | $ | 3,511,724 | �� | �� | $ | 3,258,042 | �� |
| Interest and earned fee income on loans (GAAP) | �� | �� | 98,867 | �� | �� | �� | 98,147 | �� | �� | �� | 90,879 | �� |
| BaaS loan expense | �� | �� | (32,483 | ) | �� | �� | (32,507 | ) | �� | �� | (29,011 | ) |
| Net loan income(2) | �� | $ | 66,384 | �� | �� | $ | 65,640 | �� | �� | $ | 61,868 | �� |
| Loan income, net of BaaS loan expense, divided by average loans (1)(2) | �� | �� | 7.46 | % | �� | �� | 7.58 | % | �� | �� | 7.64 | % |
| �� | ||||||||||||
| (1) Annualized calculations shown for periods presented. | ||||||||||||
| (2) A reconciliation of the non-GAAP measures are set forth at the end of this earnings release. | ||||||||||||
| �� | ||||||||||||
Average investment securities decreased
Cost of funds was
The following table summarizes the average yield on loans receivable and cost of deposits:
| �� | For the Three Months Ended | ||||||||||||||||
| �� | June 30, 2025 | �� | March 31, 2025 | �� | June 30, 2024 | ||||||||||||
| �� | Yield on Loans (2) | �� | Cost of Deposits (2) | �� | Yield on Loans (2) | �� | Cost of Deposits (2) | �� | Yield on Loans (2) | �� | Cost of Deposits (2) | ||||||
| Community Bank | 6.53 | % | �� | 1.77 | % | �� | 6.53 | % | �� | 1.76 | % | �� | 6.52 | % | �� | 1.77 | % |
| CCBX (1) | 16.22 | % | �� | 3.96 | % | �� | 16.88 | % | �� | 4.01 | % | �� | 17.75 | % | �� | 4.92 | % |
| Consolidated | 11.11 | % | �� | 3.10 | % | �� | 11.33 | % | �� | 3.08 | % | �� | 11.22 | % | �� | 3.58 | % |
| (1)��CCBX yield on loans does not include the impact of BaaS loan expense.����BaaS loan expense represents the amount paid or payable to partners for credit and fraud enhancements and originating & servicing CCBX loans. To determine Net BaaS loan��income earned from CCBX loan relationships, the Company takes BaaS loan interest income and deducts BaaS loan expense to arrive at Net BaaS loan income which can be compared to interest income on the Company’s community bank loans. See reconciliation of the non-GAAP measures at the end of this earnings release for the impact of BaaS loan expense on CCBX loan yield. | |||||||||||||||||
| (2)��Annualized calculations for periods presented. | |||||||||||||||||
| �� | |||||||||||||||||
The following table illustrates how BaaS loan interest income is affected by BaaS loan expense resulting in net BaaS loan income and the associated yield:
| �� | �� | For the Three Months Ended | ||||||||||||||||
| �� | �� | June 30, 2025 | �� | March 31, 2025 | �� | June 30, 2024 | ||||||||||||
| (dollars in thousands, unaudited) | �� | Income / Expense | �� | Income / expense divided by average CCBX loans (2) | �� | Income / Expense | �� | Income / expense divided by average CCBX loans(2) | �� | Income / Expense | �� | Income / expense divided by average CCBX loans (2) | ||||||
| BaaS loan interest income | �� | $ | 68,264 | �� | 16.22 | % | �� | $ | 67,855 | �� | 16.88 | % | �� | $ | 60,138 | �� | 17.75 | % |
| Less: BaaS loan expense | �� | �� | 32,483 | �� | 7.72 | % | �� | �� | 32,507 | �� | 8.09 | % | �� | �� | 29,011 | �� | 8.56 | % |
| Net BaaS loan income (1) | �� | $ | 35,781 | �� | 8.50 | % | �� | $ | 35,348 | �� | 8.79 | % | �� | $ | 31,127 | �� | 9.19 | % |
| Average BaaS Loans(3) | �� | $ | 1,688,492 | �� | �� | �� | $ | 1,630,088 | �� | �� | �� | $ | 1,362,343 | �� | �� | |||
| �� | ||||||||||||||||||
| (1) A reconciliation of the non-GAAP measures are set forth at the end of this earnings release. | ||||||||||||||||||
| (2) Annualized calculations shown for the periods presented. | ||||||||||||||||||
| (3) Includes loans held for sale. | ||||||||||||||||||
| �� | ||||||||||||||||||
Noninterest Income Discussion
Noninterest income was
The
Noninterest Expense Discussion
Total noninterest expense increased
The increase in noninterest expenses for the quarter ended June��30, 2025 compared to the quarter ended June��30, 2024 was largely due to a
Certain noninterest expenses are reimbursed by our CCBX partners. In accordance with GAAP we recognize all expenses in noninterest expense and the reimbursement of expenses from our CCBX partner in noninterest income. The following table reflects the portion of noninterest expenses that are reimbursed by partners to assist in the understanding of how the increases in noninterest expense are related to expenses incurred and reimbursed by CCBX partners:
| �� | �� | Three Months Ended | ||||||||||
| �� | �� | June 30, | �� | March 31, | �� | June 30, | ||||||
| (dollars in thousands; unaudited) | �� | �� | 2025 | �� | �� | �� | 2025 | �� | �� | �� | 2024 | �� |
| Total noninterest expense (GAAP) | �� | $ | 72,832 | �� | �� | $ | 71,989 | �� | �� | $ | 57,964 | �� |
| Less: BaaS loan expense | �� | �� | 32,483 | �� | �� | �� | 32,507 | �� | �� | �� | 29,011 | �� |
| Less: BaaS fraud expense | �� | �� | 2,804 | �� | �� | �� | 1,993 | �� | �� | �� | 1,784 | �� |
| Less: Reimbursement of expenses (BaaS) | �� | �� | 646 | �� | �� | �� | 1,026 | �� | �� | �� | 857 | �� |
| Noninterest expense, net of BaaS loan expense, BaaS fraud expense and reimbursement of expenses (BaaS) (1) | �� | $ | 36,899 | �� | �� | $ | 36,463 | �� | �� | $ | 26,312 | �� |
| �� | ||||||||||||
| (1) A reconciliation of the non-GAAP measures are set forth at the end of this earnings release. | ||||||||||||
| �� | ||||||||||||
Provision for Income Taxes
The provision for income taxes was
The Company is subject to various state taxes that are assessed as CCBX activities and employees expand into other states, which has increased the overall tax rate used in calculating the provision for income taxes in the current and future periods. The Company uses a federal statutory tax rate of
Financial Condition Overview
Total assets increased
As of June��30, 2025, in addition to the
The Company, on a stand alone basis, had a cash balance of
Uninsured deposits were
Total shareholders�� equity as of June��30, 2025 increased
The Company and the Bank remained well capitalized at June��30, 2025, as summarized in the following table.
| (unaudited) | �� | Coastal Community Bank | �� | Coastal Financial Corporation | �� | Minimum Well Capitalized Ratios under Prompt Corrective Action (1) | |||
| Tier 1 Leverage Capital (to average assets) | �� | 10.33 | % | �� | 10.39 | % | �� | 5.00 | % |
| Common Equity Tier 1 Capital (to risk-weighted assets) | �� | 12.36 | % | �� | 12.32 | % | �� | 6.50 | % |
| Tier 1 Capital (to risk-weighted assets) | �� | 12.36 | % | �� | 12.41 | % | �� | 8.00 | % |
| Total Capital (to risk-weighted assets) | �� | 13.65 | % | �� | 14.90 | % | �� | 10.00 | % |
| �� | |||||||||
| (1) Presents the minimum capital ratios for an insured depository institution, such as the Bank, to be considered well capitalized under the Prompt Corrective Action framework. The minimum requirements for the Company to be considered well capitalized under Regulation Y include to maintain, on a consolidated basis, a total risk-based capital ratio of 10.0 percent or greater and a tier 1 risk-based capital ratio of 6.0 percent or greater. | |||||||||
| �� | |||||||||
Asset Quality
The allowance for credit losses was
The following table details the allocation of the allowance for credit loss as of the period indicated:
| �� | �� | As of June 30, 2025 | �� | As of March 31, 2025 | �� | As of June 30, 2024 | ||||||||||||||||||||||||||||||
| (dollars in thousands; unaudited) | �� | Community Bank | �� | CCBX | �� | Total | �� | Community Bank | �� | CCBX | �� | Total | �� | Community Bank | �� | CCBX | �� | Total | ||||||||||||||||||
| Loans receivable | �� | $ | 1,860,050 | �� | �� | $ | 1,680,280 | �� | �� | $ | 3,540,330 | �� | �� | $ | 1,866,533 | �� | �� | $ | 1,650,826 | �� | �� | $ | 3,517,359 | �� | �� | $ | 1,912,034 | �� | �� | $ | 1,409,779 | �� | �� | $ | 3,321,813 | �� |
| Allowance for credit losses | �� | �� | (18,936 | ) | �� | �� | (145,858 | ) | �� | �� | (164,794 | ) | �� | �� | (18,992 | ) | �� | �� | (164,186 | ) | �� | �� | (183,178 | ) | �� | �� | (21,046 | ) | �� | �� | (127,832 | ) | �� | �� | (148,878 | ) |
| Allowance for credit losses to total loans receivable | �� | �� | 1.02 | % | �� | �� | 8.68 | % | �� | �� | 4.65 | % | �� | �� | 1.02 | % | �� | �� | 9.95 | % | �� | �� | 5.21 | % | �� | �� | 1.10 | % | �� | �� | 9.07 | % | �� | �� | 4.48 | % |
| �� | �� | �� | �� | �� | �� | �� | �� | �� | �� | �� | �� | �� | �� | �� | �� | �� | �� | �� | �� | �� | �� | �� | �� | �� | �� | �� | �� | �� | �� | �� | �� | �� | �� | �� | �� | �� |
Net charge-offs totaled
The following table details net charge-offs for the community bank and CCBX for the period indicated:
| �� | �� | Three Months Ended | ||||||||||||||||||||||||||||||||||
| �� | �� | June 30, 2025 | �� | March 31, 2025 | �� | June 30, 2024 | ||||||||||||||||||||||||||||||
| (dollars in thousands; unaudited) | �� | Community Bank | �� | CCBX | �� | Total | �� | Community Bank | �� | CCBX | �� | Total | �� | Community Bank | �� | CCBX | �� | Total | ||||||||||||||||||
| Gross charge-offs | �� | $ | 11 | �� | �� | $ | 53,769 | �� | �� | $ | 53,780 | �� | �� | $ | 4 | �� | �� | $ | 53,682 | �� | �� | $ | 53,686 | �� | �� | $ | 2 | �� | �� | $ | 55,205 | �� | �� | $ | 55,207 | �� |
| Gross recoveries | �� | �� | (2 | ) | �� | �� | (4,465 | ) | �� | �� | (4,467 | ) | �� | �� | (7 | ) | �� | �� | (5,479 | ) | �� | �� | (5,486 | ) | �� | �� | (4 | ) | �� | �� | (2,250 | ) | �� | �� | (2,254 | ) |
| Net charge-offs | �� | $ | 9 | �� | �� | $ | 49,304 | �� | �� | $ | 49,313 | �� | �� | $ | (3 | ) | �� | $ | 48,203 | �� | �� | $ | 48,200 | �� | �� | $ | (2 | ) | �� | $ | 52,955 | �� | �� | $ | 52,953 | �� |
| Net charge-offs to average loans (1) | �� | �� | 0.00 | % | �� | �� | 11.71 | % | �� | �� | 5.54 | % | �� | �� | 0.00 | % | �� | �� | 11.99 | % | �� | �� | 5.57 | % | �� | �� | 0.00 | % | �� | �� | 15.63 | % | �� | �� | 6.54 | % |
| �� | ||||||||||||||||||||||||||||||||||||
| (1) Annualized calculations shown for periods presented. | ||||||||||||||||||||||||||||||||||||
| �� | ||||||||||||||||||||||||||||||||||||
During the quarter ended June��30, 2025, a
In accordance with accounting guidance, we estimate and record a provision for expected losses for these CCBX loans and reclassified negative deposit accounts. When the provision for CCBX credit losses and provision for unfunded commitments is recorded, a credit enhancement asset is also recorded on the balance sheet through noninterest income (BaaS credit enhancements). Expected losses are recorded in the allowance for credit losses. The credit enhancement asset is relieved when credit enhancement recoveries are received from the CCBX partner. If our partner is unable to fulfill their contracted obligations then the Bank could be exposed to additional credit losses. Management regularly evaluates and manages this counterparty risk with our CCBX partners.
The factors used in management’s analysis for community bank credit losses indicated that a provision recapture of
The following table details the provision expense/(recapture) for the community bank and CCBX for the period indicated:
| �� | �� | Three Months Ended | |||||||||
| (dollars in thousands; unaudited) | �� | June 30, 2025 | �� | March 31, 2025 | �� | June 30, 2024 | |||||
| Community bank | �� | $ | (47 | ) | �� | $ | 65 | �� | $ | (341 | ) |
| CCBX | �� | �� | 30,976 | �� | �� | �� | 54,319 | �� | �� | 62,231 | �� |
| Total provision expense | �� | $ | 30,929 | �� | �� | $ | 54,384 | �� | $ | 61,890 | �� |
| �� | |||||||||||
A provision for unfunded commitments of
At June��30, 2025, our nonperforming assets were
Nonperforming assets increased
For the quarter ended June��30, 2025, there were
The following table details the Company’s nonperforming assets for the periods indicated.
| Consolidated | As of | ||||||||||
| (dollars in thousands; unaudited) | June 30, 2025 | �� | March 31, 2025 | �� | June 30, 2024 | ||||||
| Nonaccrual loans: | �� | �� | �� | �� | �� | ||||||
| Commercial and industrial loans | $ | 2,333 | �� | �� | $ | 381 | �� | �� | $ | �� | �� |
| AG���˹ٷ� estate loans: | �� | �� | �� | �� | �� | ||||||
| Construction, land and land development | �� | 1,697 | �� | �� | �� | �� | �� | �� | �� | �� | �� |
| Residential real estate | �� | �� | �� | �� | �� | �� | �� | �� | �� | 213 | �� |
| Commercial real estate | �� | �� | �� | �� | �� | �� | �� | �� | �� | 7,731 | �� |
| Consumer and other loans: | �� | �� | �� | �� | �� | ||||||
| Credit cards | �� | 20,140 | �� | �� | �� | 13,602 | �� | �� | �� | �� | �� |
| Other consumer and other loans | �� | 4,063 | �� | �� | �� | 6,376 | �� | �� | �� | �� | �� |
| Total nonaccrual loans | �� | 28,233 | �� | �� | �� | 20,359 | �� | �� | �� | 7,944 | �� |
| Accruing loans past due 90 days or more: | �� | �� | �� | �� | �� | ||||||
| Commercial & industrial loans | �� | 926 | �� | �� | �� | 782 | �� | �� | �� | 1,278 | �� |
| AG���˹ٷ� estate loans: | �� | �� | �� | �� | �� | ||||||
| Residential real estate loans | �� | 1,817 | �� | �� | �� | 2,407 | �� | �� | �� | 2,722 | �� |
| Consumer and other loans: | �� | �� | �� | �� | �� | ||||||
| Credit cards | �� | 23,116 | �� | �� | �� | 27,187 | �� | �� | �� | 36,465 | �� |
| Other consumer and other loans | �� | 6,775 | �� | �� | �� | 5,632 | �� | �� | �� | 4,779 | �� |
| Total accruing loans past due 90 days or more | �� | 32,634 | �� | �� | �� | 36,008 | �� | �� | �� | 45,244 | �� |
| Total nonperforming loans | �� | 60,867 | �� | �� | �� | 56,367 | �� | �� | �� | 53,188 | �� |
| AG���˹ٷ� estate owned | �� | �� | �� | �� | �� | �� | �� | �� | �� | �� | �� |
| Repossessed assets | �� | �� | �� | �� | �� | �� | �� | �� | �� | �� | �� |
| Total nonperforming assets | $ | 60,867 | �� | �� | $ | 56,367 | �� | �� | $ | 53,188 | �� |
| Total nonaccrual loans to loans receivable | �� | 0.80 | % | �� | �� | 0.58 | % | �� | �� | 0.24 | % |
| Total nonperforming loans to loans receivable | �� | 1.72 | % | �� | �� | 1.60 | % | �� | �� | 1.60 | % |
| Total nonperforming assets to total assets | �� | 1.36 | % | �� | �� | 1.30 | % | �� | �� | 1.34 | % |
| �� | �� | �� | �� | �� | �� | �� | �� | �� | �� | �� | �� |
The following tables detail the CCBX and community bank nonperforming assets which are included in the total nonperforming assets table above.
| CCBX | As of | ||||||||||
| (dollars in thousands; unaudited) | June 30, 2025 | �� | March 31, 2025 | �� | June 30, 2024 | ||||||
| Nonaccrual loans: | �� | �� | �� | �� | �� | ||||||
| Commercial and industrial loans: | �� | �� | �� | �� | �� | ||||||
| All other commercial & industrial loans | $ | 188 | �� | �� | $ | 192 | �� | �� | $ | �� | �� |
| Consumer and other loans: | �� | �� | �� | �� | �� | ||||||
| Credit cards | �� | 20,140 | �� | �� | �� | 13,602 | �� | �� | �� | �� | �� |
| Other consumer and other loans | �� | 4,063 | �� | �� | �� | 6,376 | �� | �� | �� | �� | �� |
| Total nonaccrual loans | �� | 24,391 | �� | �� | �� | 20,170 | �� | �� | �� | �� | �� |
| Accruing loans past due 90 days or more: | �� | �� | �� | �� | �� | ||||||
| Commercial & industrial loans | �� | 926 | �� | �� | �� | 782 | �� | �� | �� | 1,278 | �� |
| AG���˹ٷ� estate loans: | �� | �� | �� | �� | �� | ||||||
| Residential real estate loans | �� | 1,817 | �� | �� | �� | 2,407 | �� | �� | �� | 2,722 | �� |
| Consumer and other loans: | �� | �� | �� | �� | �� | ||||||
| Credit cards | �� | 23,116 | �� | �� | �� | 27,187 | �� | �� | �� | 36,465 | �� |
| Other consumer and other loans | �� | 6,775 | �� | �� | �� | 5,632 | �� | �� | �� | 4,779 | �� |
| Total accruing loans past due 90 days or more | �� | 32,634 | �� | �� | �� | 36,008 | �� | �� | �� | 45,244 | �� |
| Total nonperforming loans | �� | 57,025 | �� | �� | �� | 56,178 | �� | �� | �� | 45,244 | �� |
| Other real estate owned | �� | �� | �� | �� | �� | �� | �� | �� | �� | �� | �� |
| Repossessed assets | �� | �� | �� | �� | �� | �� | �� | �� | �� | �� | �� |
| Total nonperforming assets | $ | 57,025 | �� | �� | $ | 56,178 | �� | �� | $ | 45,244 | �� |
| Total CCBX nonperforming assets to total consolidated assets | �� | 1.27 | % | �� | �� | 1.29 | % | �� | �� | 1.14 | % |
| �� | �� | �� | �� | �� | �� | �� | �� | �� | �� | �� | �� |
| Community Bank | As of | ||||||||||
| (dollars in thousands; unaudited) | June 30, 2025 | �� | March 31, 2025 | �� | June 30, 2024 | ||||||
| Nonaccrual loans: | �� | �� | �� | �� | �� | ||||||
| Commercial and industrial loans | $ | 2,145 | �� | �� | $ | 189 | �� | �� | $ | �� | �� |
| AG���˹ٷ� estate: | �� | �� | �� | �� | �� | ||||||
| Construction, land and land development | �� | 1,697 | �� | �� | �� | �� | �� | �� | �� | �� | �� |
| Residential real estate | �� | �� | �� | �� | �� | �� | �� | �� | �� | 213 | �� |
| Commercial real estate | �� | �� | �� | �� | �� | �� | �� | �� | �� | 7,731 | �� |
| Total nonaccrual loans | �� | 3,842 | �� | �� | �� | 189 | �� | �� | �� | 7,944 | �� |
| Accruing loans past due 90 days or more: | �� | �� | �� | �� | �� | ||||||
| Total accruing loans past due 90 days or more | �� | �� | �� | �� | �� | �� | �� | �� | �� | �� | �� |
| Total nonperforming loans | �� | 3,842 | �� | �� | �� | 189 | �� | �� | �� | 7,944 | �� |
| Other real estate owned | �� | �� | �� | �� | �� | �� | �� | �� | �� | �� | �� |
| Repossessed assets | �� | �� | �� | �� | �� | �� | �� | �� | �� | �� | �� |
| Total nonperforming assets | $ | 3,842 | �� | �� | $ | 189 | �� | �� | $ | 7,944 | �� |
| Total community bank nonperforming assets to total consolidated assets | �� | 0.09 | % | �� | �� | �� | % | �� | �� | 0.20 | % |
| �� | �� | �� | �� | �� | �� | �� | �� | �� | �� | �� | �� |
About Coastal Financial
Coastal Financial Corporation (Nasdaq: CCB) (the “Company��), is an Everett, Washington based bank holding company whose wholly owned subsidiaries are Coastal Community Bank (“Bank��) and Arlington Olympic LLC.����The
CCB-ER
Contact
Eric Sprink, Chief Executive Officer, (425) 357-3659
Joel Edwards, Executive Vice President & Chief Financial Officer, (425) 357-3687
Forward-Looking Statements
This earnings release contains forward-looking statements within the meaning of the Private Securities Litigation Reform Act of 1995. These forward-looking statements reflect our current views with respect to, among other things, future events and our financial performance. Any statements about our management’s expectations, beliefs, plans, predictions, forecasts, objectives, assumptions or future events or performance are not historical facts and may be forward-looking. These statements are often, but not always, made through the use of words or phrases such as “anticipate,�� “believes,�� “can,�� “could,�� “may,�� “predicts,�� “potential,�� “should,�� “will,�� “estimate,�� “plans,�� “projects,�� “continuing,�� “ongoing,�� “expects,�� “intends�� and similar words or phrases. Any or all of the forward-looking statements in this earnings release may turn out to be inaccurate. The inclusion of or reference to forward-looking information in this earnings release should not be regarded as a representation by us or any other person that the future plans, estimates or expectations contemplated by us will be achieved. We have based these forward looking statements largely on our current expectations and projections about future events and financial trends that we believe may affect our financial condition, results of operations, business strategy and financial needs. Our actual results could differ materially from those anticipated in such forward-looking statements as a result of risks, uncertainties and assumptions that are difficult to predict. Factors that could cause actual results to differ materially from those in the forward-looking statements include, without limitation, the risk that changes in U.S. trade policies, including the imposition of tariffs and retaliatory tariffs, may adversely impact our business, financial condition, and results of operations and those other risks and uncertainties discussed under “Risk Factors�� in our Annual Report on Form 10-K for the most recent period filed and in any of our subsequent filings with the Securities and Exchange Commission.
If one or more events related to these or other risks or uncertainties materialize, or if our underlying assumptions prove to be incorrect, actual results may differ materially from what we anticipate. You are cautioned not to place undue reliance on forward-looking statements. Further, any forward-looking statement speaks only as of the date on which it is made, and we undertake no obligation to update or revise any forward-looking statement to reflect events or circumstances after the date on which the statement is made or to reflect the occurrence of unanticipated events, except as required by law.
COASTAL FINANCIAL CORPORATION
CONDENSED CONSOLIDATED STATEMENTS OF FINANCIAL CONDITION
(Dollars in thousands; unaudited)
| ASSETS | |||||||||||||||||||
| �� | June 30, 2025 | �� | March 31, 2025 | �� | December 31, 2024 | �� | September 30, 2024 | �� | June 30, 2024 | ||||||||||
| Cash and due from banks | $ | 29,546 | �� | �� | $ | 43,467 | �� | �� | $ | 36,533 | �� | �� | $ | 45,327 | �� | �� | $ | 59,995 | �� |
| Interest earning deposits with other banks | �� | 690,213 | �� | �� | �� | 580,835 | �� | �� | �� | 415,980 | �� | �� | �� | 438,699 | �� | �� | �� | 427,250 | �� |
| Investment securities, available for sale, at fair value | �� | 33 | �� | �� | �� | 34 | �� | �� | �� | 35 | �� | �� | �� | 38 | �� | �� | �� | 39 | �� |
| Investment securities, held to maturity, at amortized cost | �� | 45,544 | �� | �� | �� | 46,957 | �� | �� | �� | 47,286 | �� | �� | �� | 48,582 | �� | �� | �� | 49,174 | �� |
| Other investments | �� | 12,521 | �� | �� | �� | 12,589 | �� | �� | �� | 10,800 | �� | �� | �� | 10,757 | �� | �� | �� | 10,664 | �� |
| Loans held for sale | �� | 60,474 | �� | �� | �� | 42,132 | �� | �� | �� | 20,600 | �� | �� | �� | 7,565 | �� | �� | �� | �� | �� |
| Loans receivable | �� | 3,540,330 | �� | �� | �� | 3,517,359 | �� | �� | �� | 3,486,565 | �� | �� | �� | 3,413,894 | �� | �� | �� | 3,321,813 | �� |
| Allowance for credit losses | �� | (164,794 | ) | �� | �� | (183,178 | ) | �� | �� | (176,994 | ) | �� | �� | (171,674 | ) | �� | �� | (148,878 | ) |
| Total loans receivable, net | �� | 3,375,536 | �� | �� | �� | 3,334,181 | �� | �� | �� | 3,309,571 | �� | �� | �� | 3,242,220 | �� | �� | �� | 3,172,935 | �� |
| CCBX credit enhancement asset | �� | 167,779 | �� | �� | �� | 183,377 | �� | �� | �� | 181,890 | �� | �� | �� | 173,600 | �� | �� | �� | 149,096 | �� |
| CCBX receivable | �� | 13,009 | �� | �� | �� | 12,685 | �� | �� | �� | 14,138 | �� | �� | �� | 16,060 | �� | �� | �� | 11,520 | �� |
| Premises and equipment, net | �� | 29,052 | �� | �� | �� | 28,639 | �� | �� | �� | 27,431 | �� | �� | �� | 25,833 | �� | �� | �� | 24,526 | �� |
| Lease right-of-use assets | �� | 4,891 | �� | �� | �� | 5,117 | �� | �� | �� | 5,219 | �� | �� | �� | 5,427 | �� | �� | �� | 5,635 | �� |
| Accrued interest receivable | �� | 20,849 | �� | �� | �� | 21,109 | �� | �� | �� | 21,104 | �� | �� | �� | 22,315 | �� | �� | �� | 21,620 | �� |
| Bank-owned life insurance, net | �� | 13,648 | �� | �� | �� | 13,501 | �� | �� | �� | 13,375 | �� | �� | �� | 13,255 | �� | �� | �� | 13,132 | �� |
| Deferred tax asset, net | �� | 3,829 | �� | �� | �� | 3,912 | �� | �� | �� | 3,600 | �� | �� | �� | 3,083 | �� | �� | �� | 2,221 | �� |
| Other assets | �� | 13,635 | �� | �� | �� | 10,747 | �� | �� | �� | 13,646 | �� | �� | �� | 11,711 | �� | �� | �� | 11,742 | �� |
| Total assets | $ | 4,480,559 | �� | �� | $ | 4,339,282 | �� | �� | $ | 4,121,208 | �� | �� | $ | 4,064,472 | �� | �� | $ | 3,959,549 | �� |
| �� | �� | �� | �� | �� | �� | �� | �� | �� | �� | ||||||||||
| LIABILITIES AND SHAREHOLDERS�� EQUITY | |||||||||||||||||||
| LIABILITIES | �� | �� | �� | �� | �� | �� | �� | �� | �� | ||||||||||
| Deposits | $ | 3,913,571 | �� | �� | $ | 3,791,229 | �� | �� | $ | 3,585,332 | �� | �� | $ | 3,627,288 | �� | �� | $ | 3,543,432 | �� |
| Subordinated debt, net | �� | 44,368 | �� | �� | �� | 44,331 | �� | �� | �� | 44,293 | �� | �� | �� | 44,256 | �� | �� | �� | 44,219 | �� |
| Junior subordinated debentures, net | �� | 3,592 | �� | �� | �� | 3,592 | �� | �� | �� | 3,591 | �� | �� | �� | 3,591 | �� | �� | �� | 3,591 | �� |
| Deferred compensation | �� | 295 | �� | �� | �� | 310 | �� | �� | �� | 332 | �� | �� | �� | 369 | �� | �� | �� | 405 | �� |
| Accrued interest payable | �� | 954 | �� | �� | �� | 1,107 | �� | �� | �� | 962 | �� | �� | �� | 1,070 | �� | �� | �� | 999 | �� |
| Lease liabilities | �� | 5,063 | �� | �� | �� | 5,293 | �� | �� | �� | 5,398 | �� | �� | �� | 5,609 | �� | �� | �� | 5,821 | �� |
| CCBX payable | �� | 32,939 | �� | �� | �� | 29,391 | �� | �� | �� | 29,171 | �� | �� | �� | 37,839 | �� | �� | �� | 32,539 | �� |
| Other liabilities | �� | 18,068 | �� | �� | �� | 14,112 | �� | �� | �� | 13,425 | �� | �� | �� | 12,520 | �� | �� | �� | 11,850 | �� |
| Total liabilities | �� | 4,018,850 | �� | �� | �� | 3,889,365 | �� | �� | �� | 3,682,504 | �� | �� | �� | 3,732,542 | �� | �� | �� | 3,642,856 | �� |
| SHAREHOLDERS�� EQUITY | �� | �� | �� | �� | �� | �� | �� | �� | �� | ||||||||||
| Common Stock | �� | 230,423 | �� | �� | �� | 229,659 | �� | �� | �� | 228,177 | �� | �� | �� | 134,769 | �� | �� | �� | 132,989 | �� |
| Retained earnings | �� | 231,287 | �� | �� | �� | 220,259 | �� | �� | �� | 210,529 | �� | �� | �� | 197,162 | �� | �� | �� | 183,706 | �� |
| Accumulated other comprehensive loss, net of tax | �� | (1 | ) | �� | �� | (1 | ) | �� | �� | (2 | ) | �� | �� | (1 | ) | �� | �� | (2 | ) |
| Total shareholders�� equity | �� | 461,709 | �� | �� | �� | 449,917 | �� | �� | �� | 438,704 | �� | �� | �� | 331,930 | �� | �� | �� | 316,693 | �� |
| Total liabilities and shareholders�� equity | $ | 4,480,559 | �� | �� | $ | 4,339,282 | �� | �� | $ | 4,121,208 | �� | �� | $ | 4,064,472 | �� | �� | $ | 3,959,549 | �� |
| �� | |||||||||||||||||||
COASTAL FINANCIAL CORPORATION
CONDENSED CONSOLIDATED STATEMENTS OF INCOME
(Dollars in thousands, except per share amounts; unaudited)
| �� | Three Months Ended | |||||||||||||||
| �� | June 30, 2025 | �� | March 31, 2025 | �� | December 31, 2024 | �� | September 30, 2024 | �� | June 30, 2024 | |||||||
| INTEREST AND DIVIDEND INCOME | �� | �� | �� | �� | �� | �� | �� | �� | �� | |||||||
| Interest and fees on loans | $ | 98,867 | �� | �� | $ | 98,147 | �� | $ | 95,575 | �� | $ | 99,676 | �� | $ | 90,879 | �� |
| Interest on interest earning deposits with other banks | �� | 8,085 | �� | �� | �� | 6,070 | �� | �� | 6,021 | �� | �� | 4,781 | �� | �� | 5,683 | �� |
| Interest on investment securities | �� | 626 | �� | �� | �� | 650 | �� | �� | 661 | �� | �� | 675 | �� | �� | 686 | �� |
| Dividends on other investments | �� | 219 | �� | �� | �� | 40 | �� | �� | 191 | �� | �� | 33 | �� | �� | 174 | �� |
| Total interest income | �� | 107,797 | �� | �� | �� | 104,907 | �� | �� | 102,448 | �� | �� | 105,165 | �� | �� | 97,422 | �� |
| INTEREST EXPENSE | �� | �� | �� | �� | �� | �� | �� | �� | �� | |||||||
| Interest on deposits | �� | 30,400 | �� | �� | �� | 28,185 | �� | �� | 29,404 | �� | �� | 32,083 | �� | �� | 30,578 | �� |
| Interest on borrowed funds | �� | 660 | �� | �� | �� | 660 | �� | �� | 667 | �� | �� | 809 | �� | �� | 672 | �� |
| Total interest expense | �� | 31,060 | �� | �� | �� | 28,845 | �� | �� | 30,071 | �� | �� | 32,892 | �� | �� | 31,250 | �� |
| Net interest income | �� | 76,737 | �� | �� | �� | 76,062 | �� | �� | 72,377 | �� | �� | 72,273 | �� | �� | 66,172 | �� |
| PROVISION FOR CREDIT LOSSES | �� | 32,211 | �� | �� | �� | 55,781 | �� | �� | 61,867 | �� | �� | 70,257 | �� | �� | 62,325 | �� |
| Net interest income/(expense) after provision for credit losses | �� | 44,526 | �� | �� | �� | 20,281 | �� | �� | 10,510 | �� | �� | 2,016 | �� | �� | 3,847 | �� |
| NONINTEREST INCOME | �� | �� | �� | �� | �� | �� | �� | �� | �� | |||||||
| Service charges and fees | �� | 913 | �� | �� | �� | 860 | �� | �� | 932 | �� | �� | 952 | �� | �� | 946 | �� |
| Loan referral fees | �� | �� | �� | �� | �� | �� | �� | �� | �� | �� | �� | �� | �� | �� | �� | �� |
| Unrealized gain (loss) on equity securities, net | �� | (439 | ) | �� | �� | 16 | �� | �� | 1 | �� | �� | 2 | �� | �� | 9 | �� |
| Other income | �� | 853 | �� | �� | �� | 682 | �� | �� | 473 | �� | �� | 486 | �� | �� | 257 | �� |
| Noninterest income, excluding BaaS program income and BaaS indemnification income | �� | 1,327 | �� | �� | �� | 1,558 | �� | �� | 1,406 | �� | �� | 1,440 | �� | �� | 1,212 | �� |
| Servicing and other BaaS fees | �� | 1,539 | �� | �� | �� | 1,419 | �� | �� | 1,043 | �� | �� | 1,044 | �� | �� | 1,525 | �� |
| Transaction and interchange fees | �� | 5,109 | �� | �� | �� | 3,833 | �� | �� | 3,699 | �� | �� | 3,549 | �� | �� | 2,934 | �� |
| Reimbursement of expenses | �� | 646 | �� | �� | �� | 1,026 | �� | �� | 812 | �� | �� | 565 | �� | �� | 857 | �� |
| BaaS program income | �� | 7,294 | �� | �� | �� | 6,278 | �� | �� | 5,554 | �� | �� | 5,158 | �� | �� | 5,316 | �� |
| BaaS credit enhancements | �� | 31,268 | �� | �� | �� | 53,648 | �� | �� | 62,097 | �� | �� | 70,108 | �� | �� | 60,826 | �� |
| BaaS fraud enhancements | �� | 2,804 | �� | �� | �� | 1,993 | �� | �� | 5,043 | �� | �� | 2,084 | �� | �� | 1,784 | �� |
| BaaS indemnification income | �� | 34,072 | �� | �� | �� | 55,641 | �� | �� | 67,140 | �� | �� | 72,192 | �� | �� | 62,610 | �� |
| Total noninterest income | �� | 42,693 | �� | �� | �� | 63,477 | �� | �� | 74,100 | �� | �� | 78,790 | �� | �� | 69,138 | �� |
| NONINTEREST EXPENSE | �� | �� | �� | �� | �� | �� | �� | �� | �� | |||||||
| Salaries and employee benefits | �� | 21,401 | �� | �� | �� | 21,482 | �� | �� | 17,955 | �� | �� | 17,060 | �� | �� | 16,973 | �� |
| Occupancy | �� | 915 | �� | �� | �� | 1,034 | �� | �� | 958 | �� | �� | 964 | �� | �� | 985 | �� |
| Data processing and software licenses | �� | 5,541 | �� | �� | �� | 4,882 | �� | �� | 4,049 | �� | �� | 4,338 | �� | �� | 3,977 | �� |
| Legal and professional expenses | �� | 5,962 | �� | �� | �� | 5,888 | �� | �� | 4,606 | �� | �� | 3,597 | �� | �� | 3,311 | �� |
| Point of sale expense | �� | 69 | �� | �� | �� | 107 | �� | �� | 89 | �� | �� | 73 | �� | �� | 72 | �� |
| Excise taxes | �� | 681 | �� | �� | �� | 722 | �� | �� | 778 | �� | �� | 762 | �� | �� | (706 | ) |
| Federal Deposit Insurance Corporation ("FDIC") assessments | �� | 790 | �� | �� | �� | 755 | �� | �� | 750 | �� | �� | 740 | �� | �� | 690 | �� |
| Director and staff expenses | �� | 612 | �� | �� | �� | 631 | �� | �� | 683 | �� | �� | 559 | �� | �� | 470 | �� |
| Marketing | �� | 50 | �� | �� | �� | 50 | �� | �� | 28 | �� | �� | 67 | �� | �� | 14 | �� |
| Other expense | �� | 1,524 | �� | �� | �� | 1,938 | �� | �� | 1,752 | �� | �� | 1,482 | �� | �� | 1,383 | �� |
| Noninterest expense, excluding BaaS loan and BaaS fraud expense | �� | 37,545 | �� | �� | �� | 37,489 | �� | �� | 31,648 | �� | �� | 29,642 | �� | �� | 27,169 | �� |
| BaaS loan expense | �� | 32,483 | �� | �� | �� | 32,507 | �� | �� | 30,720 | �� | �� | 32,698 | �� | �� | 29,011 | �� |
| BaaS fraud expense | �� | 2,804 | �� | �� | �� | 1,993 | �� | �� | 5,043 | �� | �� | 2,084 | �� | �� | 1,784 | �� |
| BaaS loan and fraud expense | �� | 35,287 | �� | �� | �� | 34,500 | �� | �� | 35,763 | �� | �� | 34,782 | �� | �� | 30,795 | �� |
| Total noninterest expense | �� | 72,832 | �� | �� | �� | 71,989 | �� | �� | 67,411 | �� | �� | 64,424 | �� | �� | 57,964 | �� |
| Income before provision for income taxes | �� | 14,387 | �� | �� | �� | 11,769 | �� | �� | 17,199 | �� | �� | 16,382 | �� | �� | 15,021 | �� |
| PROVISION FOR INCOME TAXES | �� | 3,359 | �� | �� | �� | 2,039 | �� | �� | 3,832 | �� | �� | 2,926 | �� | �� | 3,425 | �� |
| NET INCOME | $ | 11,028 | �� | �� | $ | 9,730 | �� | $ | 13,367 | �� | $ | 13,456 | �� | $ | 11,596 | �� |
| Basic earnings per common share | $ | 0.73 | �� | �� | $ | 0.65 | �� | $ | 0.97 | �� | $ | 1.00 | �� | $ | 0.86 | �� |
| Diluted earnings per common share | $ | 0.71 | �� | �� | $ | 0.63 | �� | $ | 0.94 | �� | $ | 0.97 | �� | $ | 0.84 | �� |
| Weighted average number of common shares outstanding: | �� | �� | �� | �� | �� | �� | �� | �� | �� | |||||||
| Basic | �� | 15,033,296 | �� | �� | �� | 14,962,507 | �� | �� | 13,828,605 | �� | �� | 13,447,066 | �� | �� | 13,412,667 | �� |
| Diluted | �� | 15,447,923 | �� | �� | �� | 15,462,041 | �� | �� | 14,268,229 | �� | �� | 13,822,270 | �� | �� | 13,736,508 | �� |
| �� | �� | �� | �� | �� | �� | �� | �� | �� | �� | �� | �� | �� | �� | �� | �� | �� |
COASTAL FINANCIAL CORPORATION
AVERAGE BALANCES, YIELDS, AND RATES �� QUARTERLY
(Dollars in thousands; unaudited)
| �� | For the Three Months Ended | ||||||||||||||||||||||||||||
| �� | June 30, 2025 | �� | March 31, 2025 | �� | June 30, 2024 | ||||||||||||||||||||||||
| �� | Average Balance | �� | Interest & Dividends | �� | Yield / Cost (1) | �� | Average Balance | �� | Interest & Dividends | �� | Yield / Cost (1) | �� | Average Balance | �� | Interest & Dividends | �� | Yield / Cost (1) | ||||||||||||
| Assets | �� | �� | �� | �� | �� | �� | �� | �� | �� | �� | �� | �� | �� | �� | �� | �� | �� | ||||||||||||
| Interest earning assets: | �� | �� | �� | �� | �� | �� | �� | �� | �� | �� | �� | �� | �� | �� | �� | �� | �� | ||||||||||||
| Interest earning deposits with other banks | $ | 729,652 | �� | �� | $ | 8,085 | �� | 4.44 | % | �� | $ | 553,393 | �� | �� | $ | 6,070 | �� | 4.45 | % | �� | $ | 418,165 | �� | �� | $ | 5,683 | �� | 5.47 | % |
| Investment securities, available for sale (2) | �� | 35 | �� | �� | �� | �� | �� | �� | �� | �� | �� | 37 | �� | �� | �� | 1 | �� | 10.96 | �� | �� | �� | 43 | �� | �� | �� | �� | �� | �� | �� |
| Investment securities, held to maturity (2) | �� | 46,256 | �� | �� | �� | 626 | �� | 5.43 | �� | �� | �� | 47,154 | �� | �� | �� | 649 | �� | 5.58 | �� | �� | �� | 49,737 | �� | �� | �� | 686 | �� | 5.55 | �� |
| Other investments | �� | 12,825 | �� | �� | �� | 219 | �� | 6.85 | �� | �� | �� | 11,757 | �� | �� | �� | 40 | �� | 1.38 | �� | �� | �� | 10,592 | �� | �� | �� | 174 | �� | 6.61 | �� |
| Loans receivable (3) | �� | 3,567,823 | �� | �� | �� | 98,867 | �� | 11.11 | �� | �� | �� | 3,511,724 | �� | �� | �� | 98,147 | �� | 11.33 | �� | �� | �� | 3,258,042 | �� | �� | �� | 90,879 | �� | 11.22 | �� |
| Total interest earning assets | �� | 4,356,591 | �� | �� | �� | 107,797 | �� | 9.92 | �� | �� | �� | 4,124,065 | �� | �� | �� | 104,907 | �� | 10.32 | �� | �� | �� | 3,736,579 | �� | �� | �� | 97,422 | �� | 10.49 | �� |
| Noninterest earning assets: | �� | �� | �� | �� | �� | �� | �� | �� | �� | �� | �� | �� | �� | �� | �� | �� | �� | ||||||||||||
| Allowance for credit losses | �� | (176,022 | ) | �� | �� | �� | �� | �� | �� | (170,542 | ) | �� | �� | �� | �� | �� | �� | (138,472 | ) | �� | �� | �� | �� | ||||||
| Other noninterest earning assets | �� | 298,698 | �� | �� | �� | �� | �� | �� | �� | 296,993 | �� | �� | �� | �� | �� | �� | �� | 255,205 | �� | �� | �� | �� | �� | ||||||
| Total assets | $ | 4,479,267 | �� | �� | �� | �� | �� | �� | $ | 4,250,516 | �� | �� | �� | �� | �� | �� | $ | 3,853,312 | �� | �� | �� | �� | �� | ||||||
| �� | �� | �� | �� | �� | �� | �� | �� | �� | �� | �� | �� | �� | �� | �� | �� | �� | �� | ||||||||||||
| Liabilities and Shareholders�� Equity | �� | �� | �� | �� | �� | �� | �� | �� | �� | �� | �� | �� | �� | �� | �� | �� | �� | ||||||||||||
| Interest bearing liabilities: | �� | �� | �� | �� | �� | �� | �� | �� | �� | �� | �� | �� | �� | �� | �� | �� | �� | ||||||||||||
| Interest bearing deposits | $ | 3,369,574 | �� | �� | $ | 30,400 | �� | 3.62 | % | �� | $ | 3,166,384 | �� | �� | $ | 28,185 | �� | 3.61 | % | �� | $ | 2,854,575 | �� | �� | $ | 30,578 | �� | 4.31 | % |
| FHLB advances and other borrowings | �� | 3 | �� | �� | �� | 1 | �� | �� | �� | �� | �� | �� | �� | �� | �� | 1 | �� | �� | �� | �� | �� | 1,648 | �� | �� | �� | 3 | �� | 0.73 | �� |
| Subordinated debt | �� | 44,345 | �� | �� | �� | 598 | �� | 5.41 | �� | �� | �� | 44,309 | �� | �� | �� | 598 | �� | 5.47 | �� | �� | �� | 44,197 | �� | �� | �� | 598 | �� | 5.44 | �� |
| Junior subordinated debentures | �� | 3,592 | �� | �� | �� | 61 | �� | 6.81 | �� | �� | �� | 3,592 | �� | �� | �� | 61 | �� | 6.89 | �� | �� | �� | 3,590 | �� | �� | �� | 71 | �� | 7.95 | �� |
| Total interest bearing liabilities | �� | 3,417,514 | �� | �� | �� | 31,060 | �� | 3.65 | �� | �� | �� | 3,214,285 | �� | �� | �� | 28,845 | �� | 3.64 | �� | �� | �� | 2,904,010 | �� | �� | �� | 31,250 | �� | 4.33 | �� |
| Noninterest bearing deposits | �� | 562,174 | �� | �� | �� | �� | �� | �� | �� | 543,784 | �� | �� | �� | �� | �� | �� | �� | 584,661 | �� | �� | �� | �� | �� | ||||||
| Other liabilities | �� | 44,452 | �� | �� | �� | �� | �� | �� | �� | 49,624 | �� | �� | �� | �� | �� | �� | �� | 58,267 | �� | �� | �� | �� | �� | ||||||
| Total shareholders' equity | �� | 455,127 | �� | �� | �� | �� | �� | �� | �� | 442,823 | �� | �� | �� | �� | �� | �� | �� | 306,374 | �� | �� | �� | �� | �� | ||||||
| Total liabilities and shareholders' equity | $ | 4,479,267 | �� | �� | �� | �� | �� | �� | $ | 4,250,516 | �� | �� | �� | �� | �� | �� | $ | 3,853,312 | �� | �� | �� | �� | �� | ||||||
| Net interest income | �� | �� | $ | 76,737 | �� | �� | �� | �� | �� | $ | 76,062 | �� | �� | �� | �� | �� | $ | 66,172 | �� | �� | |||||||||
| Interest rate spread | �� | �� | �� | �� | 6.27 | % | �� | �� | �� | �� | �� | 6.68 | % | �� | �� | �� | �� | �� | 6.16 | % | |||||||||
| Net interest margin (4) | �� | �� | �� | �� | 7.06 | % | �� | �� | �� | �� | �� | 7.48 | % | �� | �� | �� | �� | �� | 7.12 | % | |||||||||
| �� | |||||||||||||||||||||||||||||
| (1)����Yields and costs are annualized. | |||||||||||||||||||||||||||||
| (2)����For presentation in this table, average balances and the corresponding average rates for investment securities are based upon historical cost, adjusted for amortization of premiums and accretion of discounts. | |||||||||||||||||||||||||||||
| (3)����Includes loans held for sale and nonaccrual loans. | |||||||||||||||||||||||||||||
| (4)����Net interest margin represents net interest income divided by the average total interest earning assets. | |||||||||||||||||||||||||||||
| �� | |||||||||||||||||||||||||||||
COASTAL FINANCIAL CORPORATION
SELECTED AVERAGE BALANCES, YIELDS, AND RATES �� BY SEGMENT - QUARTERLY
(Dollars in thousands; unaudited)
| �� | For the Three Months Ended | |||||||||||||||||||||||||
| �� | June 30, 2025 | �� | March 31, 2025 | �� | June 30, 2024 | |||||||||||||||||||||
| (dollars in thousands, unaudited) | Average Balance | �� | Interest & Dividends | �� | Yield / Cost (1) | �� | Average Balance | �� | Interest & Dividends | �� | Yield / Cost (1) | �� | Average Balance | �� | Interest & Dividends | �� | Yield / Cost (1) | |||||||||
| Community Bank | �� | �� | �� | �� | �� | �� | �� | �� | �� | �� | �� | �� | �� | �� | �� | �� | �� | |||||||||
| Assets | �� | �� | �� | �� | �� | �� | �� | �� | �� | �� | �� | �� | �� | �� | �� | �� | �� | |||||||||
| Interest earning assets: | �� | �� | �� | �� | �� | �� | �� | �� | �� | �� | �� | �� | �� | �� | �� | �� | �� | |||||||||
| Loans receivable (2) | $ | 1,879,331 | �� | $ | 30,603 | �� | 6.53 | % | �� | $ | 1,881,636 | �� | $ | 30,292 | �� | 6.53 | % | �� | $ | 1,895,699 | �� | $ | 30,741 | �� | 6.52 | % |
| Total interest earning assets | �� | 1,879,331 | �� | �� | 30,603 | �� | 6.53 | �� | �� | �� | 1,881,636 | �� | �� | 30,292 | �� | 6.53 | �� | �� | �� | 1,895,699 | �� | �� | 30,741 | �� | 6.52 | �� |
| Liabilities | �� | �� | �� | �� | �� | �� | �� | �� | �� | �� | �� | �� | �� | �� | �� | �� | �� | |||||||||
| Interest bearing liabilities: | �� | �� | �� | �� | �� | �� | �� | �� | �� | �� | �� | �� | �� | �� | �� | �� | ||||||||||
| Interest bearing deposits | �� | 1,048,506 | �� | �� | 6,783 | �� | 2.59 | % | �� | �� | 1,045,971 | �� | �� | 6,604 | �� | 2.56 | % | �� | �� | 938,033 | �� | �� | 6,459 | �� | 2.77 | % |
| Intrabank liability | �� | 342,232 | �� | �� | 3,792 | �� | 4.44 | �� | �� | �� | 356,337 | �� | �� | 3,909 | �� | 4.45 | �� | �� | �� | 429,452 | �� | �� | 5,836 | �� | 5.47 | �� |
| Total interest bearing liabilities | �� | 1,390,738 | �� | �� | 10,575 | �� | 3.05 | �� | �� | �� | 1,402,308 | �� | �� | 10,513 | �� | 3.04 | �� | �� | �� | 1,367,485 | �� | �� | 12,295 | �� | 3.62 | �� |
| Noninterest bearing deposits | �� | 488,593 | �� | �� | �� | �� | �� | �� | 479,329 | �� | �� | �� | �� | �� | �� | 528,214 | �� | �� | �� | �� | ||||||
| Net interest income | �� | �� | $ | 20,028 | �� | �� | �� | �� | �� | $ | 19,779 | �� | �� | �� | �� | �� | $ | 18,446 | �� | �� | ||||||
| Net interest margin(3) | �� | �� | �� | �� | 4.27 | % | �� | �� | �� | �� | �� | 4.26 | % | �� | �� | �� | �� | �� | 3.91 | % | ||||||
| �� | �� | �� | �� | �� | �� | �� | �� | �� | �� | �� | �� | �� | �� | �� | �� | �� | �� | |||||||||
| CCBX | �� | �� | �� | �� | �� | �� | �� | �� | �� | �� | �� | �� | �� | �� | �� | �� | �� | |||||||||
| Assets | �� | �� | �� | �� | �� | �� | �� | �� | �� | �� | �� | �� | �� | �� | �� | �� | �� | |||||||||
| Interest earning assets: | �� | �� | �� | �� | �� | �� | �� | �� | �� | �� | �� | �� | �� | �� | �� | �� | �� | |||||||||
| Loans receivable (2)(4) | $ | 1,688,492 | �� | $ | 68,264 | �� | 16.22 | % | �� | $ | 1,630,088 | �� | $ | 67,855 | �� | 16.88 | % | �� | $ | 1,362,343 | �� | $ | 60,138 | �� | 17.75 | % |
| Intrabank asset | �� | 706,157 | �� | �� | 7,825 | �� | 4.44 | �� | �� | �� | 554,781 | �� | �� | 6,085 | �� | 4.45 | �� | �� | �� | 610,646 | �� | �� | 8,299 | �� | 5.47 | �� |
| Total interest earning assets | �� | 2,394,649 | �� | �� | 76,089 | �� | 12.74 | �� | �� | �� | 2,184,869 | �� | �� | 73,940 | �� | 13.72 | �� | �� | �� | 1,972,989 | �� | �� | 68,437 | �� | 13.95 | �� |
| Liabilities | �� | �� | �� | �� | �� | �� | �� | �� | �� | �� | �� | �� | �� | �� | �� | �� | �� | |||||||||
| Interest bearing liabilities: | �� | �� | �� | �� | �� | �� | �� | �� | �� | �� | �� | �� | �� | �� | ||||||||||||
| Interest bearing deposits | �� | 2,321,068 | �� | �� | 23,617 | �� | 4.08 | % | �� | �� | 2,120,413 | �� | �� | 21,581 | �� | 4.13 | % | �� | �� | 1,916,542 | �� | �� | 24,119 | �� | 5.06 | % |
| Total interest bearing liabilities | �� | 2,321,068 | �� | �� | 23,617 | �� | 4.08 | �� | �� | �� | 2,120,413 | �� | �� | 21,581 | �� | 4.13 | �� | �� | �� | 1,916,542 | �� | �� | 24,119 | �� | 5.06 | �� |
| Noninterest bearing deposits | �� | 73,581 | �� | �� | �� | �� | �� | �� | 64,455 | �� | �� | �� | �� | �� | �� | 56,447 | �� | �� | �� | �� | ||||||
| Net interest income | �� | �� | $ | 52,472 | �� | �� | �� | �� | �� | $ | 52,359 | �� | �� | �� | �� | �� | $ | 44,318 | �� | �� | ||||||
| Net interest margin(3) | �� | �� | �� | �� | 8.79 | % | �� | �� | �� | �� | �� | 9.72 | % | �� | �� | �� | �� | �� | 9.03 | % | ||||||
| Net interest margin, net of BaaS loan expense(5) | �� | �� | �� | �� | 3.35 | % | �� | �� | �� | �� | �� | 3.68 | % | �� | �� | �� | �� | �� | 3.12 | % | ||||||
| �� | �� | �� | �� | �� | �� | �� | �� | �� | �� | �� | �� | �� | �� | �� | �� | �� | �� | �� | �� | �� | ||||||
| �� | For the Three Months Ended | |||||||||||||||||||||||||
| �� | June 30, 2025 | �� | March 31, 2025 | �� | June 30, 2024 | |||||||||||||||||||||
| (dollars in thousands, unaudited) | Average Balance | �� | Interest & Dividends | �� | Yield / Cost (1) | �� | Average Balance | �� | Interest & Dividends | �� | Yield / Cost (1) | �� | Average Balance | �� | Interest & Dividends | �� | Yield / Cost (1) | |||||||||
| Treasury & Administration | �� | �� | �� | �� | �� | �� | �� | �� | �� | �� | �� | �� | �� | �� | ||||||||||||
| Assets | �� | �� | �� | �� | �� | �� | �� | �� | �� | �� | �� | �� | �� | �� | �� | �� | �� | |||||||||
| Interest earning assets: | �� | �� | �� | �� | �� | �� | �� | �� | �� | �� | �� | �� | �� | �� | �� | �� | �� | |||||||||
| Interest earning deposits with other banks | $ | 729,652 | �� | $ | 8,085 | �� | 4.44 | % | �� | $ | 553,393 | �� | $ | 6,070 | �� | 4.45 | % | �� | $ | 418,165 | �� | $ | 5,683 | �� | 5.47 | % |
| Investment securities, available for sale (6) | �� | 35 | �� | �� | �� | �� | �� | �� | �� | �� | 37 | �� | �� | 1 | �� | 10.96 | �� | �� | �� | 43 | �� | �� | �� | �� | 3.13 | �� |
| Investment securities, held to maturity (6) | �� | 46,256 | �� | �� | 626 | �� | 5.43 | �� | �� | �� | 47,154 | �� | �� | 649 | �� | 5.58 | �� | �� | �� | 49,737 | �� | �� | 686 | �� | 5.55 | �� |
| Other investments | �� | 12,825 | �� | �� | 219 | �� | 6.85 | �� | �� | �� | 11,757 | �� | �� | 40 | �� | 1.38 | �� | �� | �� | 10,592 | �� | �� | 174 | �� | 6.61 | �� |
| Total interest earning assets | �� | 788,768 | �� | �� | 8,930 | �� | 4.54 | % | �� | �� | 612,341 | �� | �� | 6,760 | �� | 4.48 | % | �� | �� | 478,537 | �� | �� | 6,543 | �� | 5.50 | % |
| Liabilities | �� | �� | �� | �� | �� | �� | �� | �� | �� | �� | �� | �� | �� | �� | �� | �� | �� | |||||||||
| Interest bearing liabilities: | �� | �� | �� | �� | �� | �� | �� | �� | �� | �� | �� | �� | �� | �� | �� | �� | �� | |||||||||
| FHLB advances and borrowings | $ | 3 | �� | �� | 1 | �� | �� | �� | �� | $ | �� | �� | �� | 1 | �� | �� | % | �� | $ | 1,648 | �� | �� | 3 | �� | 0.73 | % |
| Subordinated debt | �� | 44,345 | �� | �� | 598 | �� | 5.41 | �� | �� | �� | 44,309 | �� | �� | 598 | �� | 5.47 | �� | �� | �� | 44,197 | �� | �� | 598 | �� | 5.44 | �� |
| Junior subordinated debentures | �� | 3,592 | �� | �� | 61 | �� | 6.81 | �� | �� | �� | 3,592 | �� | �� | 61 | �� | 6.89 | �� | �� | �� | 3,590 | �� | �� | 71 | �� | 7.95 | �� |
| Intrabank liability, net (7) | �� | 363,925 | �� | �� | 4,033 | �� | 4.44 | �� | �� | �� | 198,444 | �� | �� | 2,176 | �� | 4.45 | �� | �� | �� | 181,194 | �� | �� | 2,463 | �� | 5.47 | �� |
| Total interest bearing liabilities | �� | 411,865 | �� | �� | 4,693 | �� | 4.57 | �� | �� | �� | 246,345 | �� | �� | 2,836 | �� | 4.67 | �� | �� | �� | 230,629 | �� | �� | 3,135 | �� | 5.47 | �� |
| Net interest income | �� | �� | $ | 4,237 | �� | �� | �� | �� | �� | $ | 3,924 | �� | �� | �� | �� | �� | $ | 3,408 | �� | �� | ||||||
| Net interest margin(3) | �� | �� | �� | �� | 2.15 | % | �� | �� | �� | �� | �� | 2.60 | % | �� | �� | �� | �� | �� | 2.86 | % | ||||||
| �� | ||||||||||||||||||||||||||
| (1)��Yields and costs are annualized. | ||||||||||||||||||||||||||
| (2)��Includes loans held for sale and nonaccrual loans. | ||||||||||||||||||||||||||
| (3)��Net interest margin represents net interest income divided by the average total interest earning assets. | ||||||||||||||||||||||||||
| (4)��CCBX yield does not include the impact of BaaS loan expense. BaaS loan expense represents the amount paid or payable to partners for credit enhancements, fraud enhancements and originating & servicing CCBX loans. See reconciliation of the non-GAAP measures at the end of this earnings release for the impact of BaaS loan expense on CCBX loan yield. | ||||||||||||||||||||||||||
| (5)��Net interest margin, net of BaaS loan expense, includes the impact of BaaS loan expense. BaaS loan expense represents the amount paid or payable to partners for credit enhancements, fraud enhancements, originating & servicing CCBX loans. See reconciliation of the non-GAAP measures at the end of this earnings release. | ||||||||||||||||||||||||||
| (6)��For presentation in this table, average balances and the corresponding average rates for investment securities are based upon historical cost, adjusted for amortization of premiums and accretion of discounts. | ||||||||||||||||||||||||||
| (7)��Intrabank assets and liabilities are consolidated for period calculations and presented as intrabank asset, net or intrabank liability, net in the table above. | ||||||||||||||||||||||||||
| �� | ||||||||||||||||||||||||||
Non-GAAP Financial Measures
The Company uses certain non-GAAP financial measures to provide meaningful supplemental information regarding the Company’s operational performance and to enhance investors�� overall understanding of such financial performance.
However, these non-GAAP financial measures are supplemental and are not a substitute for an analysis based on GAAP measures. As other companies may use different calculations for these adjusted measures, this presentation may not be comparable to other similarly titled adjusted measures reported by other companies.
The following non-GAAP measures are presented to illustrate the impact of BaaS loan expense on net loan income and yield on loans and CCBX loans and the impact of BaaS loan expense on net interest income and net interest margin.
Loan income, net of BaaS loan expense, divided by average loans, is a non-GAAP measure that includes the impact BaaS loan expense on loan income and the yield on loans. The most directly comparable GAAP measure is yield on loans.
Net BaaS loan income divided by average CCBX loans is a non-GAAP measure that includes the impact BaaS loan expense on net BaaS loan income and the yield on CCBX loans. The most directly comparable GAAP measure is yield on CCBX loans.
Net interest income, net of BaaS loan expense, is a non-GAAP measure that includes the impact BaaS loan expense on net interest income. The most directly comparable GAAP measure is net interest income.
CCBX net interest margin, net of BaaS loan expense, is a non-GAAP measure that includes the impact of BaaS loan expense on net interest rate margin. The most directly comparable GAAP measure is CCBX net interest margin.
Reconciliations of the GAAP and non-GAAP measures are presented below.
| CCBX | �� | As of and for the Three Months Ended | ||||||||||
| (dollars in thousands; unaudited) | �� | June 30 2025 | �� | March 31 2025 | �� | June 30 2024 | ||||||
| Net BaaS loan income divided by average CCBX loans: | ||||||||||||
| CCBX loan yield (GAAP)(1) | �� | �� | 16.22 | % | �� | �� | 16.88 | % | �� | �� | 17.75 | % |
| Total average CCBX loans receivable | �� | $ | 1,688,492 | �� | �� | $ | 1,630,088 | �� | �� | $ | 1,362,343 | �� |
| Interest and earned fee income on CCBX loans (GAAP) | �� | �� | 68,264 | �� | �� | �� | 67,855 | �� | �� | �� | 60,138 | �� |
| BaaS loan expense | �� | �� | (32,483 | ) | �� | �� | (32,507 | ) | �� | �� | (29,011 | ) |
| Net BaaS loan income | �� | $ | 35,781 | �� | �� | $ | 35,348 | �� | �� | $ | 31,127 | �� |
| Net BaaS loan income divided by average CCBX loans (1) | �� | �� | 8.50 | % | �� | �� | 8.79 | % | �� | �� | 9.19 | % |
| CCBX net interest margin, net of BaaS loan expense: | �� | �� | �� | �� | ||||||||
| CCBX net interest margin (1) | �� | �� | 8.79 | % | �� | �� | 9.72 | % | �� | �� | 9.03 | % |
| CCBX earning assets | �� | �� | 2,394,649 | �� | �� | �� | 2,184,869 | �� | �� | �� | 1,972,989 | �� |
| Net interest income (GAAP) | �� | �� | 52,472 | �� | �� | �� | 52,359 | �� | �� | �� | 44,318 | �� |
| Less: BaaS loan expense | �� | �� | (32,483 | ) | �� | �� | (32,507 | ) | �� | �� | (29,011 | ) |
| Net interest income, net of BaaS loan expense | �� | $ | 19,989 | �� | �� | $ | 19,852 | �� | �� | $ | 15,307 | �� |
| CCBX net interest margin, net of BaaS loan expense (1) | �� | �� | 3.35 | % | �� | �� | 3.68 | % | �� | �� | 3.12 | % |
| �� | ||||||||||||
| Consolidated | �� | As of and for the Three Months Ended | ||||||||||
| (dollars in thousands; unaudited) | �� | June 30 2025 | �� | March 31 2025 | �� | June 30 2024 | ||||||
| Net interest margin, net of BaaS loan expense: | �� | �� | �� | �� | ||||||||
| Net interest margin (1) | �� | �� | 7.06 | % | �� | �� | 7.48 | % | �� | �� | 7.12 | % |
| Earning assets | �� | �� | 4,356,591 | �� | �� | �� | 4,124,065 | �� | �� | �� | 3,736,579 | �� |
| Net interest income (GAAP) | �� | �� | 76,737 | �� | �� | �� | 76,062 | �� | �� | �� | 66,172 | �� |
| Less: BaaS loan expense | �� | �� | (32,483 | ) | �� | �� | (32,507 | ) | �� | �� | (29,011 | ) |
| Net interest income, net of BaaS loan expense | �� | $ | 44,254 | �� | �� | $ | 43,555 | �� | �� | $ | 37,161 | �� |
| Net interest margin, net of BaaS loan expense (1) | �� | �� | 4.07 | % | �� | �� | 4.28 | % | �� | �� | 4.00 | % |
| Loan income net of BaaS loan expense divided by average loans: | �� | �� | ||||||||||
| Loan yield (GAAP)(1) | �� | �� | 11.11 | % | �� | �� | 11.33 | % | �� | �� | 11.22 | % |
| Total average loans receivable | �� | $ | 3,567,823 | �� | �� | $ | 3,511,724 | �� | �� | $ | 3,258,042 | �� |
| Interest and earned fee income on loans (GAAP) | �� | �� | 98,867 | �� | �� | �� | 98,147 | �� | �� | �� | 90,879 | �� |
| BaaS loan expense | �� | �� | (32,483 | ) | �� | �� | (32,507 | ) | �� | �� | (29,011 | ) |
| Net loan income | �� | $ | 66,384 | �� | �� | $ | 65,640 | �� | �� | $ | 61,868 | �� |
| Loan income, net of BaaS loan expense, divided by average loans (1) | �� | �� | 7.46 | % | �� | �� | 7.58 | % | �� | �� | 7.64 | % |
| �� | ||||||||||||
| (1) Annualized calculations for periods presented. | ||||||||||||
| �� | ||||||||||||
The following non-GAAP measure is presented to illustrate the impact of BaaS loan expense, BaaS fraud expense and reimbursement of expenses (BaaS) on noninterest expense. Certain noninterest expenses are reimbursed by our CCBX partners. In accordance with GAAP we recognize all expenses in noninterest expense and the reimbursement of expenses from our CCBX partner in noninterest income. This non-GAAP measure shows the portion of noninterest expenses that are reimbursed by partners to assist the understanding of how the increases in noninterest expense are related to expenses incurred for and reimbursed by CCBX partner. The most comparable GAAP measure is noninterest expense.
| �� | �� | As of and for the Three Months Ended | ||||||||
| (dollars in thousands, unaudited) | �� | June 30, 2025 | �� | March 31, 2025 | �� | June 30, 2024 | ||||
| Noninterest expense, net of reimbursement of expenses (BaaS) | ||||||||||
| Noninterest expense (GAAP) | �� | $ | 72,832 | �� | $ | 71,989 | �� | $ | 57,964 | �� |
| Less: BaaS loan expense | �� | �� | 32,483 | �� | �� | 32,507 | �� | �� | 29,011 | �� |
| Less: BaaS fraud expense | �� | �� | 2,804 | �� | �� | 1,993 | �� | �� | 1,784 | �� |
| Less: Reimbursement of expenses | �� | �� | 646 | �� | �� | 1,026 | �� | �� | 857 | �� |
| Noninterest expense, net of BaaS loan expense, BaaS fraud expense and reimbursement of expenses | �� | $ | 36,899 | �� | $ | 36,463 | �� | $ | 26,312 | �� |
| �� | ||||||||||
APPENDIX A -
As of June��30, 2025
Industry Concentration
We have a diversified loan portfolio, representing a wide variety of industries. Our major categories of loans are commercial real estate, consumer and other loans, residential real estate, commercial and industrial, and construction, land and land development loans. Together they represent
Commercial real estate loans represent the largest segment of our loans, comprising
The following table summarizes our loan commitment by industry for our commercial real estate portfolio as of June��30, 2025:
| (dollars in thousands; unaudited) | �� | Outstanding Balance | �� | Available Loan Commitments | �� | Total Outstanding Balance & Available Commitment | �� | % of Total Loans (Outstanding Balance & Available Commitment) | �� | Average Loan Balance | �� | Number of Loans | �� | |||||
| Apartments | �� | $ | 362,315 | �� | $ | 2,889 | �� | $ | 365,204 | �� | 6.7 | % | �� | $ | 3,814 | �� | 95 | �� |
| Hotel/Motel | �� | �� | 154,877 | �� | �� | 1,073 | �� | �� | 155,950 | �� | 2.8 | �� | �� | �� | 6,734 | �� | 23 | �� |
| Convenience Store | �� | �� | 135,118 | �� | �� | 546 | �� | �� | 135,664 | �� | 2.5 | �� | �� | �� | 2,290 | �� | 59 | �� |
| Office | �� | �� | 119,622 | �� | �� | 6,666 | �� | �� | 126,288 | �� | 2.3 | �� | �� | �� | 1,375 | �� | 87 | �� |
| Warehouse | �� | �� | 102,688 | �� | �� | �� | �� | �� | 102,688 | �� | 1.9 | �� | �� | �� | 1,770 | �� | 58 | �� |
| Retail | �� | �� | 93,552 | �� | �� | 836 | �� | �� | 94,388 | �� | 1.7 | �� | �� | �� | 936 | �� | 100 | �� |
| Mixed use | �� | �� | 93,455 | �� | �� | 5,287 | �� | �� | 98,742 | �� | 1.8 | �� | �� | �� | 1,126 | �� | 83 | �� |
| Mini Storage | �� | �� | 73,695 | �� | �� | 7,272 | �� | �� | 80,967 | �� | 1.5 | �� | �� | �� | 3,685 | �� | 20 | �� |
| Strip Mall | �� | �� | 43,468 | �� | �� | �� | �� | �� | 43,468 | �� | 0.8 | �� | �� | �� | 6,210 | �� | 7 | �� |
| Manufacturing | �� | �� | 35,274 | �� | �� | 570 | �� | �� | 35,844 | �� | 0.7 | �� | �� | �� | 1,306 | �� | 27 | �� |
| Groups < | �� | �� | 96,818 | �� | �� | 4,938 | �� | �� | 101,756 | �� | 1.8 | �� | �� | �� | 1,226 | �� | 79 | �� |
| Total | �� | $ | 1,310,882 | �� | $ | 30,077 | �� | $ | 1,340,959 | �� | 24.5 | % | �� | $ | 2,055 | �� | 638 | �� |
| �� | ||||||||||||||||||
Consumer loans comprise
The following table summarizes our loan commitment by industry for our consumer and other loan portfolio as of June��30, 2025:
| (dollars in thousands; unaudited) | �� | �� | Outstanding Balance | �� | Available Loan Commitments (1) | �� | Total Outstanding Balance & Available Commitment (1) | �� | % of Total Loans (Outstanding Balance & Available Commitment) | �� | Average Loan Balance | �� | Number of Loans | �� | |||||
| CCBX consumer loans | |||||||||||||||||||
| Credit cards | �� | �� | $ | 533,925 | �� | $ | 702,611 | �� | $ | 1,236,536 | �� | 22.6 | % | �� | $ | 1.6 | �� | 337,749 | �� |
| Installment loans | �� | �� | �� | 671,089 | �� | �� | 30,817 | �� | �� | 701,906 | �� | 12.8 | �� | �� | �� | 0.8 | �� | 796,927 | �� |
| Lines of credit | �� | �� | �� | 676 | �� | �� | 14 | �� | �� | 690 | �� | 0.0 | �� | �� | �� | 0.9 | �� | 715 | �� |
| Other loans | �� | �� | �� | 14,556 | �� | �� | �� | �� | �� | 14,556 | �� | 0.3 | �� | �� | �� | 0.1 | �� | 240,653 | �� |
| Community bank consumer loans | |||||||||||||||||||
| Installment loans | �� | �� | �� | 738 | �� | �� | 2 | �� | �� | 740 | �� | 0.0 | �� | �� | �� | 30.8 | �� | 24 | �� |
| Lines of credit | �� | �� | �� | 178 | �� | �� | 339 | �� | �� | 517 | �� | 0.0 | �� | �� | �� | 5.7 | �� | 31 | �� |
| Other loans | �� | �� | �� | 11,314 | �� | �� | 13,000 | �� | �� | 24,314 | �� | 0.4 | �� | �� | �� | 32.6 | �� | 347 | �� |
| Total | �� | �� | $ | 1,232,476 | �� | $ | 746,783 | �� | $ | 1,979,259 | �� | 36.1 | % | �� | $ | 0.9 | �� | 1,376,446 | �� |
| �� | |||||||||||||||||||
| (1)����Total exposure on CCBX loans is subject to CCBX partner/portfolio maximum limits. | |||||||||||||||||||
| �� | |||||||||||||||||||
Residential real estate loans comprise
The following table summarizes our loan commitment by industry for our residential real estate loan portfolio as of June��30, 2025:
| (dollars in thousands; unaudited) | �� | Outstanding Balance | �� | Available Loan Commitments (1) | �� | Total Outstanding Balance & Available Commitment (1) | �� | % of Total Loans (Outstanding Balance & Available Commitment) | �� | Average Loan Balance | �� | Number of Loans | �� | |||||
| CCBX residential real estate loans | ||||||||||||||||||
| Home equity line of credit | �� | $ | 234,786 | �� | $ | 509,297 | �� | $ | 744,083 | �� | 13.6 | % | �� | $ | 27 | �� | 8,735 | �� |
| Community bank residential real estate loans | ||||||||||||||||||
| Closed end, secured by first liens | �� | �� | 162,205 | �� | �� | 1,064 | �� | �� | 163,269 | �� | 3.0 | �� | �� | �� | 554 | �� | 293 | �� |
| Home equity line of credit | �� | �� | 30,328 | �� | �� | 46,270 | �� | �� | 76,598 | �� | 1.4 | �� | �� | �� | 122 | �� | 249 | �� |
| Closed end, second liens | �� | �� | 6,311 | �� | �� | 1,073 | �� | �� | 7,384 | �� | 0.1 | �� | �� | �� | 218 | �� | 29 | �� |
| Total | �� | $ | 433,630 | �� | $ | 557,704 | �� | $ | 991,334 | �� | 18.1 | % | �� | $ | 47 | �� | 9,306 | �� |
| �� | ||||||||||||||||||
| (1)����Total exposure on CCBX loans is subject to CCBX partner/portfolio maximum limits. CCBX home equity lines of credit are limited to a | ||||||||||||||||||
| �� | ||||||||||||||||||
Commercial and industrial loans comprise
The following table summarizes our loan commitment by industry for our commercial and industrial loan portfolio as of June��30, 2025:
| (dollars in thousands; unaudited) | �� | Outstanding Balance | �� | Available Loan Commitments (1) | �� | Total Outstanding Balance & Available Commitment (1) | �� | % of Total Loans (Outstanding Balance & Available Commitment) | �� | Average Loan Balance | �� | Number of Loans | �� | |||||
| CCBX C&I loans | ||||||||||||||||||
| Capital call lines | �� | $ | 199,675 | �� | $ | 438,391 | �� | $ | 638,066 | �� | 11.6 | % | �� | $ | 1,597 | �� | 125 | �� |
| Retail and other loans | �� | �� | 26,142 | �� | �� | 23,001 | �� | �� | 49,143 | �� | 0.9 | �� | �� | �� | 9 | �� | 2,915 | �� |
| Community bank C&I loans | ||||||||||||||||||
| Construction/Contractor services | �� | �� | 30,449 | �� | �� | 32,173 | �� | �� | 62,622 | �� | 1.1 | �� | �� | �� | 154 | �� | 198 | �� |
| Financial institutions | �� | �� | 51,768 | �� | �� | �� | �� | �� | 51,768 | �� | 0.9 | �� | �� | �� | 4,314 | �� | 12 | �� |
| Medical / Dental / Other care | �� | �� | 5,496 | �� | �� | 3,683 | �� | �� | 9,179 | �� | 0.2 | �� | �� | �� | 423 | �� | 13 | �� |
| Manufacturing | �� | �� | 5,325 | �� | �� | 3,976 | �� | �� | 9,301 | �� | 0.2 | �� | �� | �� | 140 | �� | 38 | �� |
| Groups < | �� | �� | 56,888 | �� | �� | 26,593 | �� | �� | 83,481 | �� | 1.6 | �� | �� | �� | 228 | �� | 250 | �� |
| Total | �� | $ | 375,743 | �� | $ | 527,817 | �� | $ | 903,560 | �� | 16.5 | % | �� | $ | 106 | �� | 3,551 | �� |
| �� | ||||||||||||||||||
| (1) Total exposure on CCBX loans is subject to CCBX partner/portfolio maximum limits. | ||||||||||||||||||
| �� | ||||||||||||||||||
Construction, land and land development loans comprise
The following table details our loan commitment for our construction, land and land development portfolio as of June��30, 2025:
| (dollars in thousands; unaudited) | �� | Outstanding Balance | �� | Available Loan Commitments | �� | Total Outstanding Balance & Available Commitment | �� | % of Total Loans (Outstanding Balance & Available Commitment) | �� | Average Loan Balance | �� | Number of Loans | �� | |||||
| Commercial construction | �� | $ | 104,078 | �� | $ | 48,309 | �� | $ | 152,387 | �� | 2.8 | % | �� | $ | 7,434 | �� | 14 | �� |
| Residential construction | �� | �� | 39,831 | �� | �� | 17,340 | �� | �� | 57,171 | �� | 1.0 | �� | �� | �� | 2,655 | �� | 15 | �� |
| Developed land loans | �� | �� | 22,875 | �� | �� | 604 | �� | �� | 23,479 | �� | 0.4 | �� | �� | �� | 1,271 | �� | 18 | �� |
| Undeveloped land loans | �� | �� | 20,067 | �� | �� | 748 | �� | �� | 20,815 | �� | 0.4 | �� | �� | �� | 1,338 | �� | 15 | �� |
| Land development | �� | �� | 7,299 | �� | �� | 3,048 | �� | �� | 10,347 | �� | 0.2 | �� | �� | �� | 811 | �� | 9 | �� |
| Total | �� | $ | 194,150 | �� | $ | 70,049 | �� | $ | 264,199 | �� | 4.8 | % | �� | $ | 2,735 | �� | 71 | �� |
| �� | ||||||||||||||||||
Exposure and risk in our construction, land and land development portfolio increased compared to recent periods as indicated in the following table:
| �� | �� | Outstanding Balance as of | ||||||||||||||||||
| (dollars in thousands; unaudited) | �� | June 30, 2025 | �� | March 31, 2025 | �� | December 31, 2024 | �� | September 30, 2024 | �� | June 30, 2024 | ||||||||||
| Commercial construction | �� | $ | 104,078 | �� | �� | $ | 96,716 | �� | �� | $ | 83,216 | �� | �� | $ | 97,792 | �� | �� | $ | 110,372 | �� |
| Residential construction | �� | �� | 39,831 | �� | �� | �� | 39,375 | �� | �� | �� | 40,940 | �� | �� | �� | 35,822 | �� | �� | �� | 34,652 | �� |
| Undeveloped land loans | �� | �� | 20,067 | �� | �� | �� | 16,684 | �� | �� | �� | 8,665 | �� | �� | �� | 8,606 | �� | �� | �� | 8,372 | �� |
| Developed land loans | �� | �� | 22,875 | �� | �� | �� | 7,788 | �� | �� | �� | 8,305 | �� | �� | �� | 14,863 | �� | �� | �� | 13,954 | �� |
| Land development | �� | �� | 7,299 | �� | �� | �� | 5,988 | �� | �� | �� | 7,072 | �� | �� | �� | 5,968 | �� | �� | �� | 5,714 | �� |
| Total | �� | $ | 194,150 | �� | �� | $ | 166,551 | �� | �� | $ | 148,198 | �� | �� | $ | 163,051 | �� | �� | $ | 173,064 | �� |
| �� | ||||||||||||||||||||
Commitments to extend credit total
The following table presents outstanding commitments to extend credit as of June��30, 2025:
| Consolidated | �� | �� | ||
| (dollars in thousands; unaudited) | �� | As of June 30, 2025 (1) | ||
| Commitments to extend credit: | �� | �� | ||
| Commercial and industrial loans | �� | $ | 89,426 | �� |
| Commercial and industrial loans - capital call lines | �� | �� | 438,391 | �� |
| Construction �� commercial real estate loans | �� | �� | 52,709 | �� |
| Construction �� residential real estate loans | �� | �� | 17,340 | �� |
| Residential real estate loans | �� | �� | 557,704 | �� |
| Commercial real estate loans | �� | �� | 30,077 | �� |
| Credit cards | �� | �� | 702,611 | �� |
| Consumer and other loans | �� | �� | 44,172 | �� |
| Total commitments to extend credit | �� | $ | 1,932,430 | �� |
| �� | ||||
| (1)��Total exposure on CCBX loans is subject to CCBX partner/portfolio maximum limits. | ||||
| �� | ||||
We have individual CCBX partner portfolio limits with our each of our partners to manage loan concentration risk, liquidity risk, and counter-party partner risk. For example, as of June��30, 2025, capital call lines outstanding balance totaled
See the table below for CCBX portfolio maximums and related available commitments:
| CCBX | �� | �� | �� | �� | �� | �� | �� | �� | |||||||
| (dollars in thousands; unaudited) | �� | Balance | �� | Percent of CCBX loans receivable | Available Commitments (1) | �� | Maximum Portfolio Size | Cash Reserve/Pledge Account Amount (2) | |||||||
| Commercial and industrial loans: | �� | �� | �� | �� | �� | �� | |||||||||
| Capital call lines | �� | $ | 199,675 | �� | �� | 11.9 | % | $ | 438,391 | �� | $ | 350,000 | $ | �� | �� |
| All other commercial & industrial loans | �� | �� | 26,142 | �� | �� | 1.6 | �� | �� | 23,001 | �� | �� | 471,186 | �� | 531 | �� |
| AG���˹ٷ� estate loans: | �� | �� | �� | �� | �� | �� | �� | �� | |||||||
| Home equity lines of credit (3) | �� | �� | 234,786 | �� | �� | 14.0 | �� | �� | 509,297 | �� | �� | 375,000 | �� | 36,469 | �� |
| Consumer and other loans: | �� | �� | �� | �� | �� | �� | |||||||||
| Credit cards - cash secured | �� | �� | 364 | �� | �� | �� | �� | �� | �� | �� | �� | �� | �� | ||
| Credit cards - unsecured | �� | �� | 533,561 | �� | �� | �� | �� | 702,611 | �� | �� | �� | 30,827 | �� | ||
| Credit cards - total | �� | �� | 533,925 | �� | �� | 31.8 | �� | �� | 702,611 | �� | �� | 850,000 | �� | 30,827 | �� |
| Installment loans - cash secured | �� | �� | 128,861 | �� | �� | �� | �� | 30,817 | �� | �� | �� | �� | �� | ||
| Installment loans - unsecured | �� | �� | 542,228 | �� | �� | �� | �� | �� | �� | �� | �� | (38 | ) | ||
| Installment loans - total | �� | �� | 671,089 | �� | �� | 39.8 | �� | �� | 30,817 | �� | �� | 1,818,619 | �� | (38 | ) |
| Other consumer and other loans | �� | �� | 15,232 | �� | �� | 0.9 | �� | �� | 14 | �� | �� | 5,195 | �� | 275 | �� |
| Gross CCBX loans receivable | �� | �� | 1,680,849 | �� | �� | 100.0 | % | $ | 1,704,131 | �� | $ | 3,870,000 | $ | 68,064 | �� |
| Net deferred origination fees | �� | �� | (569 | ) | �� | �� | �� | �� | �� | �� | |||||
| Loans receivable | �� | $ | 1,680,280 | �� | �� | �� | �� | �� | �� | �� | |||||
| �� | |||||||||||||||
| (1) Remaining commitment available, net of outstanding balance. | |||||||||||||||
| (2) Balances are as of July��8, 2025. | |||||||||||||||
| (3) These home equity lines of credit are secured by residential real estate and are accessed by using a credit card, but are classified as 1-4 family residential properties per regulatory guidelines. | |||||||||||||||
| �� | |||||||||||||||
APPENDIX B -
As of June��30, 2025
CCBX �� BaaS Reporting Information
During the quarter ended June��30, 2025,
The Bank records contractual interest earned from the borrower on CCBX partner loans in interest income, adjusted for origination costs which are paid or payable to the CCBX partner. BaaS loan expense represents the amount paid or payable to partners for credit and fraud enhancements and originating and servicing CCBX loans. To determine net revenue (Net BaaS loan income) earned from CCBX loan relationships, the Bank takes BaaS loan interest income and deducts BaaS loan expense to arrive at Net BaaS loan income (a reconciliation of the non-GAAP measures are set forth in the preceding section of this earnings release) which can be compared to interest income on the Company’s community bank loans.
The following table illustrates how CCBX partner loan income and expenses are recorded in the financial statements:
| Loan income and related loan expense | �� | Three Months Ended | ||||||||||
| (dollars in thousands; unaudited) | �� | June 30, 2025 | �� | March 31, 2025 | �� | June 30, 2024 | ||||||
| Yield on loans (1) | �� | �� | 16.22 | % | �� | �� | 16.88 | % | �� | �� | 17.75 | % |
| BaaS loan interest income | �� | $ | 68,264 | �� | �� | $ | 67,855 | �� | �� | $ | 60,138 | �� |
| Less: BaaS loan expense | �� | �� | 32,483 | �� | �� | �� | 32,507 | �� | �� | �� | 29,011 | �� |
| Net BaaS loan income (2) | �� | $ | 35,781 | �� | �� | $ | 35,348 | �� | �� | $ | 31,127 | �� |
| Net BaaS loan income divided by average BaaS loans (1)(2) | �� | �� | 8.50 | % | �� | �� | 8.79 | % | �� | �� | 9.19 | % |
| �� | ||||||||||||
| (1) Annualized calculation for quarterly periods shown. | ||||||||||||
| (2) A reconciliation of the non-GAAP measures are set forth in the preceding section of this earnings release. | ||||||||||||
| �� | ||||||||||||
An increase in average CCBX loans receivable resulted in increased interest income on CCBX loans during the quarter ended June��30, 2025 compared to the quarter ended March��31, 2025. Our strategy is to optimize the CCBX loan portfolio and strengthen our balance sheet through originating higher quality new loans with enhanced credit standards. These higher quality loans tend to have lower stated rates and expected losses than some of our CCBX loans historically. Current loan sales and new loan growth are at more similar interest rates compared to prior periods when we were selling loans with higher risk and higher interest rates and replacing them with higher quality lower interest rate loans. We continue to reposition ourselves by managing CCBX credit and concentration levels in an effort to optimize our loan portfolio and also generate off balance sheet fee income. Growth in CCBX loans has resulted in an increase in interest income for the quarter ended June��30, 2025 compared to the quarter ended June��30, 2024.
The following tables are a summary of the interest components, direct fees and expenses of BaaS for the periods indicated and are not inclusive of all income and expense related to BaaS.
| Interest income | �� | Three Months Ended | ||||||||||
| (dollars in thousands; unaudited) | �� | June 30, 2025 | �� | March 31, 2025 | �� | June 30, 2024 | ||||||
| Loan interest income | �� | $ | 68,264 | �� | �� | $ | 67,855 | �� | �� | $ | 60,138 | �� |
| Total BaaS interest income | �� | $ | 68,264 | �� | �� | $ | 67,855 | �� | �� | $ | 60,138 | �� |
| Interest expense | �� | Three Months Ended | ||||||||||
| (dollars in thousands; unaudited) | �� | June 30, 2025 | �� | March 31, 2025 | �� | June 30, 2024 | ||||||
| BaaS interest expense | �� | $ | 23,617 | �� | �� | $ | 21,581 | �� | �� | $ | 24,119 | �� |
| Total BaaS interest expense | �� | $ | 23,617 | �� | �� | $ | 21,581 | �� | �� | $ | 24,119 | �� |
| BaaS income | �� | Three Months Ended | ||||||||
| (dollars in thousands; unaudited) | �� | June 30, 2025 | �� | March 31, 2025 | �� | June 30, 2024 | ||||
| BaaS program income: | �� | �� | �� | �� | �� | �� | ||||
| Servicing and other BaaS fees | �� | $ | 1,539 | �� | $ | 1,419 | �� | $ | 1,525 | �� |
| Transaction and interchange fees | �� | �� | 5,109 | �� | �� | 3,833 | �� | �� | 2,934 | �� |
| Reimbursement of expenses | �� | �� | 646 | �� | �� | 1,026 | �� | �� | 857 | �� |
| Total BaaS program income | �� | �� | 7,294 | �� | �� | 6,278 | �� | �� | 5,316 | �� |
| BaaS indemnification income: | �� | �� | �� | �� | �� | �� | ||||
| BaaS credit enhancements | �� | �� | 31,268 | �� | �� | 53,648 | �� | �� | 60,826 | �� |
| BaaS fraud enhancements | �� | �� | 2,804 | �� | �� | 1,993 | �� | �� | 1,784 | �� |
| BaaS indemnification income | �� | �� | 34,072 | �� | �� | 55,641 | �� | �� | 62,610 | �� |
| Total noninterest BaaS income | �� | $ | 41,366 | �� | $ | 61,919 | �� | $ | 67,926 | �� |
| �� | ||||||||||
Servicing and other BaaS fees increased
| BaaS loan and fraud expense: | �� | Three Months Ended | ||||||||||
| (dollars in thousands; unaudited) | �� | �� | June 30, 2025 | �� | �� | �� | March 31, 2025 | �� | �� | �� | June 30, 2024 | �� |
| BaaS loan expense | �� | $ | 32,483 | �� | �� | $ | 32,507 | �� | �� | $ | 29,011 | �� |
| BaaS fraud expense | �� | �� | 2,804 | �� | �� | �� | 1,993 | �� | �� | �� | 1,784 | �� |
| Total BaaS loan and fraud expense | �� | $ | 35,287 | �� | �� | $ | 34,500 | �� | �� | $ | 30,795 | �� |
| �� | ||||||||||||
Infographics accompanying this announcement are available at
