Highland Copper Announces Updated Process Plant Flow Sheet Demonstrating Increased Copper Recoveries of 87.6% and Reduced Processing Costs
Highland Copper (OTCQB:HDRSF) announced significant improvements to its Copperwood Project's process plant design, achieving increased copper recoveries of 87.6% at a 25% copper concentrate grade. The redesigned plant incorporates ultrafine flotation technology and an optimized reagent scheme, leading to reduced processing costs.
Key improvements include a mill-float-mill-float (MF2) flowsheet with de-sliming capabilities, resulting in 10-13.7% reduction in power requirements and up to $1.00 per tonne savings in operating costs. Glencore Technologies is offering a performance guarantee for the improved recovery estimates, marking a significant upgrade from the 2023 Feasibility Study's 86% recovery rate.
Highland Copper (OTCQB:HDRSF) ha annunciato importanti miglioramenti nel progetto di impianto del Copperwood, ottenendo recuperi di rame aumentati al 87,6% con una concentrazione di rame al 25%. Il nuovo progetto impiantistico integra tecnologia di flottazione ultrafine e uno schema di reagenti ottimizzato, riducendo i costi di trattamento.
Le novità principali includono un diagramma di processo mill-float-mill-float (MF2) con capacità di de-sliming, che porta a una riduzione del fabbisogno energetico del 10-13,7% e a risparmi operativi fino a $1,00 per tonnellata. Glencore Technologies offre una garanzia di prestazione sulle stime di recupero migliorate, rappresentando un significativo passo avanti rispetto al tasso di recupero dell��86% indicato nello Studio di Fattibilità 2023.
Highland Copper (OTCQB:HDRSF) anunció mejoras importantes en el diseño de la planta del proyecto Copperwood, logrando recuperos de cobre aumentados al 87,6% con un concentrado de cobre al 25%. El rediseño incorpora tecnología de flotación ultrafina y un esquema de reactivos optimizado, lo que reduce los costos de procesamiento.
Entre las mejoras clave figura un flujo mill-float-mill-float (MF2) con capacidad de deslimado, que permite una reducción del consumo eléctrico del 10-13,7% y ahorros operativos de hasta $1,00 por tonelada. Glencore Technologies ofrece una garantía de rendimiento sobre las estimaciones de recuperación mejoradas, marcando una mejora significativa respecto al 86% de la Estudio de Factibilidad de 2023.
Highland Copper (OTCQB:HDRSF)�� Copperwood 프로젝트�� 공장 설계�� 중요�� 개선�� 발표하며, 구리 회수율을 87.6%�� 높이�� 구리 농도 25%�� 콘센트레이트�� 달성했습니다. 재설계된 공장은 초미�� 부��(flottation) 기술�� 최적화된 시약 체계�� 도입�� 처리 비용�� 낮췄습니��.
주요 개선 사항으로�� mill-float-mill-float(MF2) 흐름��와 탈슬라임(de-sliming) 기능�� 포함되어 있어 전력 소모�� 10-13.7% 절감하고 운영비를 톤당 최대 $1.00까지 절약합니��. Glencore Technologies�� 개선�� 회수�� 추정�� 대�� 성능 보증�� 제공하며, 이는 2023�� 타당성 조사에서 제시�� 86% 회수율보�� �� 진전입니��.
Highland Copper (OTCQB:HDRSF) a annoncé des améliorations significatives du design de l'usine du projet Copperwood, atteignant des recouvrements de cuivre accrus à 87,6% pour un concentré de cuivre à 25%. L'usine repensée intègre une technologie de flottation ultrafine et un schéma de réactifs optimisé, entraînant une réduction des coûts de traitement.
Parmi les améliorations clés figure un flowsheet mill-float-mill-float (MF2) avec capacités de déslimage, ce qui permet une réduction des besoins énergétiques de 10 à 13,7% et des économies d'exploitation allant jusqu'à 1,00 $ par tonne. Glencore Technologies propose une garantie de performance sur les estimations de récupération améliorées, représentant une mise à niveau significative par rapport au taux de récupération de 86% du rapport d'étude de faisabilité 2023.
Highland Copper (OTCQB:HDRSF) hat bedeutende Verbesserungen am Prozesswerksdesign seines Copperwood-Projekts bekannt gegeben und damit die Kupferrückgewinnung auf 87,6% bei einem Kupferkonzentratgehalt von 25% erhöht. Die überarbeitete Anlage integriert Ultrafein-Flotationstechnologie und ein optimiertes Reagensschema, was die Verarbeitungskosten senkt.
Zu den wichtigsten Verbesserungen gehört ein Mill-Float-Mill-Float (MF2)-Flowsheet mit Entschlammungsfähigkeiten, das zu einer Reduzierung des Energiebedarfs um 10��13,7% und zu Betriebskosteneinsparungen von bis zu 1,00 $ pro Tonne führt. Glencore Technologies bietet eine Leistungszusage für die verbesserten Rückgewinnungsschätzungen, was eine deutliche Aufwertung gegenüber der im Machbarkeitsstudium 2023 genannten Rückgewinnung von 86% darstellt.
- None.
- Requires complete process plant redesign and re-engineering
- Extended timeline with construction decision pushed to 2026
- Additional variability testing still pending completion in Q4 2025
VANCOUVER, British Columbia, Sept. 04, 2025 (GLOBE NEWSWIRE) -- Highland Copper Company Inc. (TSXV: HI; OTCQB: HDRSF) (“Highland�� or the “Company��) is pleased to announce positive results from its 2025 metallurgical test work program for the
In Q1 2025, Highland initiated a metallurgical test program with the goal of improving the process plant design, incorporating ultrafine flotation technology, and broadly reconsidering the operating cost structure of the process plant. Highland is pleased to announce the process plant has been redesigned to reflect a more effective comminution circuit, a simpler flotation circuit incorporating Jameson cell ultrafine flotation technology, and an optimized reagent scheme. This is anticipated to deliver an increase in copper recoveries to
This metallurgical update is an important component of Phase 1 detailed engineering, also initiated in Q1 2025. The goal of Phase 1 engineering is to finalize design criteria related to process plant, mine, tailings, and water management. As demonstrated by the redesigned process plant, Phase 1 engineering represents a significant re-evaluation by Highland Copper’s project team, overseen by Project Director, Dr. Wynand van Dyk. Dr. van Dyk has a degree in Chemical Engineering/Extractive Metallurgy and a 30-year career in mine design, construction and operations. Highland looks forward to providing further project design updates as Phase 1 engineering concludes in September 2025.
Metallurgical Test Work Highlights:
- Comprehensive Testing Program: Conducted 45 kinetic rougher and cleaner flotation tests to refine grind parameters and reagent schemes, along with locked-cycle tests and pilot-scale testing on ultrafine flotation technology.
- Optimized Process Circuit: Adopted a mill-float-mill-float (“MF2��) flowsheet including a de-sliming stage prior to the secondary milling stage.�� The addition of a de-sliming stage ahead of the secondary milling and roughers allows for the rejection of up to
25% of the mass from the primary rougher tailings. This configuration reduces over-grinding and offers potential comminution energy savings of between 10 and13.7% . - Improved Reagent Scheme: Developed an optimized reagent suite that is expected to reduce operating costs by up to
$1.00 per tonne milled, while also improving environmental, health and safety (“EH&S��) performance. - MF2 Circuit and Improved Reagent Scheme Performance: Test work with the MF2 circuit and optimized reagent scheme delivered kinetic rougher copper recoveries of up to
92.4% at the target rougher concentrate grade of4.5% copper, a notable improvement over the89.7% baseline from 2018 test work. Kinetic cleaner circuit recoveries were maintained at levels comparable to the 2018 baseline. Importantly, locked-cycle tests confirmed up to85.8% recovery at a25% copper concentrate grade, demonstrating that the enhanced reagent scheme and MF2 configuration is capable to deliver meaningful operating cost savings without compromising metallurgical performance. - Projected Ultrafine Flotation Performance Gains: Through the introduction of ultrafine flotation technology, the adoption of an MF2 circuit, and the implementation of an optimized reagent scheme, Copperwood is now expected to achieve average copper recovery of
87.6% at a concentrate grade of25% copper, all at lower operating costs. Glencore Technologies is prepared to offer a process guarantee related to recovery and grade estimates. This marks a significant step-change from the 2023 Feasibility Study1, which reported86% recovery at25% copper grade, underscoring the strength of the redesigned metallurgical flowsheet.
Dr Wynand van Dyk, Project Director for the Copperwood project, commented: “These results represent the culmination of a complete re-evaluation and re-engineering of the Copperwood metallurgical flowsheet. The outcome is a robust circuit design, firmly grounded in fundamental principles and tailored to the orebody itself. I want to extend my sincere thanks to both the DRA and Base Met Labs teams for their dedication and countless hours of effort throughout this test work program. Once we finalize the process design, we will be well-positioned to advance confidently into the detailed engineering phase.��
Barry O’Shea, President and CEO of Highland Copper commented: “These metallurgical results represent another key milestone as we advance toward a construction decision in 2026. The outcomes support a clear pathway to lower processing costs, with projected recoveries exceeding those in our 2023 Feasibility Study. As detailed engineering progresses with DRA, we are encouraged by the potential to enhance project economics and reduce technical risk.��
Next Steps:
As announced in January 2025, Highland awarded the Front-End Engineering and Design (FEED) contracts for both the mine and process plant to DRA. The 2025 metallurgical program has provided critical data to finalize process plant design criteria under Phase 1 of the engineering program. The next steps will focus on:
- Variability Work: Completion of lock-cycle variability testing on the finalized flowsheet. This work is expected to conclude in early Q4 2025.
- Design Criteria Finalization: Confirmation of the final process design criteria ahead of initiating Phase 2 of the detailed engineering program.
SUPPORTING TECHNICAL DETAIL
Sample selection and spatial context
The 2025 metallurgical drilling campaign comprised 10 PQ-size drill holes, designed to provide representative material from the early mine years for metallurgical testing. These holes were twinned at the five locations previously sampled during the 2017-2018 flotation test work campaign, which formed the basis of the 2018 comprehensive metallurgical program conducted by SGS2 (see Figure 1). The sampling intervals, received sample masses, and assay values are summarized in Table 1.
To align with geotechnical recommendations for mine design, each metallurgical interval excluded the uppermost 30cm of the Lower Copper Bearing Sequence (LCBS), as per the geotechnical recommendations for the mine design. In total, 404 kg of core was collected and used to prepare the composite sample for the current phase of test work, as well as to prepare variability samples for the forthcoming lock-cycle variability testing.��
One of the drill holes, CW-25-211, intersected the main Copperwood Fault, providing an additional 41.7kg of mineralized fault-repeat material (sample CW-25-211FR). As this material is a structural repeat of the LCBS, it was used in preliminary bench-scale tests to replicate the performance of the 2018 flotation program. This strategy allowed Highland to preserve the primary composite material for the broader 2025 metallurgical testing campaign.
Table 1: 2025 test work sample detail
| Sample | Interval [m] | Received sample mass [kg] | Assays | |||||||||
| From | To | Cu | Fe | Au | Ag | S | CuOx | CuCN | SO4 | S2 | ||
| CW-25-210 | 143.46 | 146.26 | 40.9 | 1.89 | 6.39 | - | 2.70 | 0.55 | 0.40 | 1.17 | 0.03 | 0.52 |
| CW-25-211 | 142.95 | 145.15 | 34.1 | 1.83 | 6.23 | - | 4.17 | 0.51 | 0.41 | 1.17 | 0.04 | 0.48 |
| CW-25-212 | 173.26 | 176.24 | 45.4 | 2.29 | 6.19 | - | 5.03 | 0.62 | 0.42 | 1.52 | 0.01 | 0.61 |
| CW-25-213 | 172.82 | 175.80 | 45.4 | 2.20 | 6.09 | - | 4.67 | 0.66 | 0.21 | 1.76 | 0.07 | 0.59 |
| CW-25-214 | 228.20 | 230.51 | 35.5 | 2.21 | 6.16 | - | 4.53 | 0.61 | 0.23 | 1.82 | 0.02 | 0.59 |
| CW-25-215 | 227.86 | 230.38 | 38.0 | 2.24 | 6.00 | - | 3.00 | 0.58 | 0.24 | 1.74 | 0.02 | 0.57 |
| CW-25-216 | 200.45 | 203.39 | 42.3 | 2.26 | 6.03 | - | 3.67 | 0.60 | 0.22 | 1.79 | 0.03 | 0.58 |
| CW-25-217 | 201.14 | 203.92 | 42.3 | 2.42 | 5.92 | - | 4.73 | 0.63 | 0.22 | 1.90 | 0.02 | 0.61 |
| CW-25-218 | 168.34 | 170.96 | 40.7 | 2.16 | 6.25 | - | 5.33 | 0.58 | 0.21 | 1.79 | 0.04 | 0.54 |
| CW-25-219 | 167.50 | 170.14 | 39.5 | 2.57 | 6.16 | - | 7.33 | 0.66 | 0.22 | 1.98 | 0.05 | 0.60 |
| Composite | �� | �� | 404.0 | 2.14 | 6.04 | 0.02 | 5.70 | 0.61 | 0.20 | 1.95 | 0.04 | 0.53 |
| CW-25-211FR | 145.53 | 148.37 | 41.7 | 2.18 | 6.15 | - | 2.07 | 0.61 | 0.40 | 1.56 | 0.03 | 0.58 |
To confirm the representativeness of the 2025 composite sample, preliminary rougher bench-scale flotation tests were done. The objective of these tests was to replicate the metallurgical performance observed during the 2018 flotation program, thereby providing confidence in the validity of the new sample set.
Figure 2 presents the mass pull versus recovery curves from these preliminary tests, alongside historical data from the 2018 campaign �� specifically Test F19 and Test F71. Test F19 represented the optimal rougher flotation conditions applied during the majority of the 2018 test work, while test F71 served as the baseline for a campaign which employed excessive NaHS dosages exceeding 2,600 g/t.��
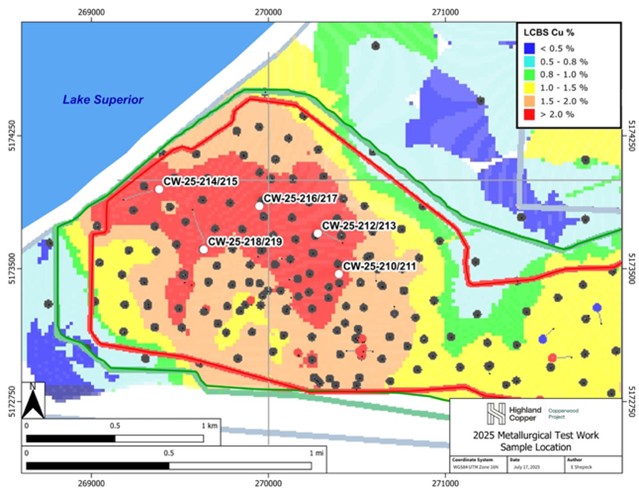
Figure 1: 2025 metallurgical test work sample locations corresponding with 2018 SGS metallurgical campaign.
As shown in Figure 2, the 2025 sample demonstrates a metallurgical response consistent with the 2018 baseline results. This correlation supports the representativeness of the new composite material. On this basis an additional 19 rougher and 20 cleaner kinetic flotation tests were carried out to optimize the process flowsheet and refine the reagent scheme.
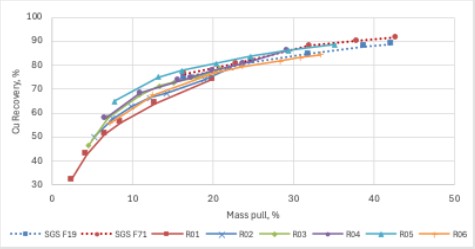
Figure 2: Mass pull versus Recovery curves for preliminary rougher tests, confirming similar response to 2018 SGS baseline
Process flowsheet and reagent scheme optimization
Preliminary rougher flotation testing revealed that the Copperwood ore body contains bimodal mineralogical fractions: a fast-floating component that responds quickly to flotation and a slower-floating bulk fraction with more protracted kinetics. As shown in Figure 3, the fast-floating material generates a high-grade initial froth characterized by well-loaded bubbles (Panel A). However, after approximately 7 minutes of flotation time, froth quality deteriorates, becoming brittle and poorly loaded (Panel B). While metallurgical upgrading continues beyond this point, the recovery rate slows significantly, requiring extended flotation residence times. An assay-by-size analysis of tailings confirmed the presence of a low-grade ultrafine (sub 20mm) fraction, likely introduced through overgrinding in the previous single-stage milling setup.
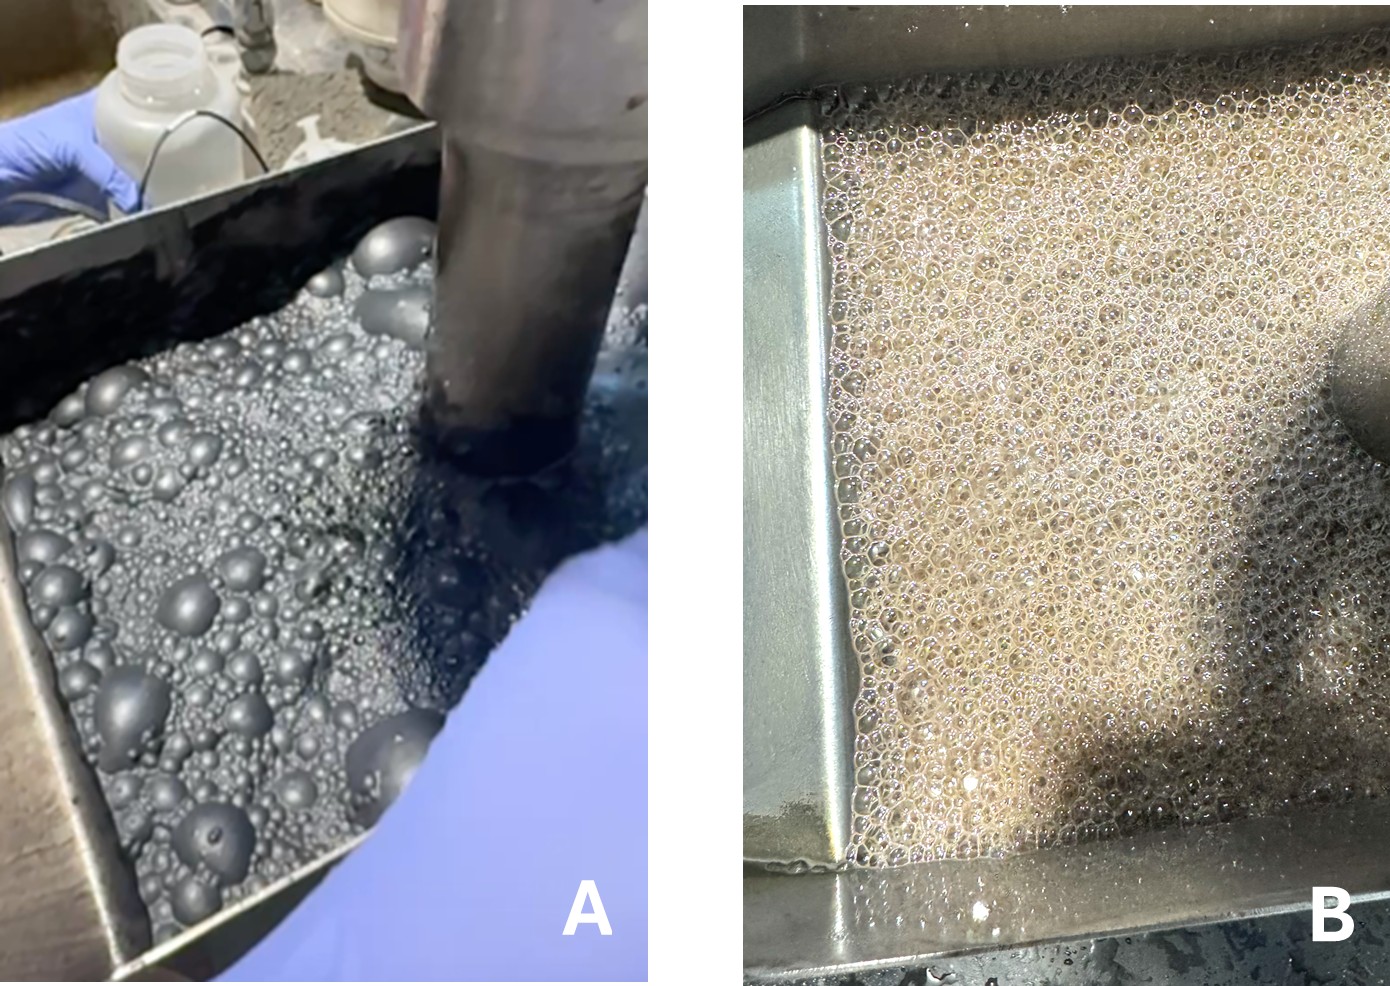
Figure 3: Initial high-grade froth (panel A) and depleted brittle froth (panel B) after 7 minutes of flotation
Adoption of an MF2 circuit
To address these challenges, the flowsheet was revised to adopt a mill-float-mill-float (MF2) configuration, incorporating a de-sliming stage between the primary and secondary milling circuits (see Figure 4). This approach, widely established in metallurgical operations, helps mitigate overgrinding and the associated fines losses.�� Grind optimization test work determined the optimal parameters as:
- Primary circuit grind P80: 80 µm
- Secondary circuit grind P80: 38 µm
Bench-scale de-sliming was performed via wet screening at 38 µm, while later pilot-scale testing employed cyclone separation.
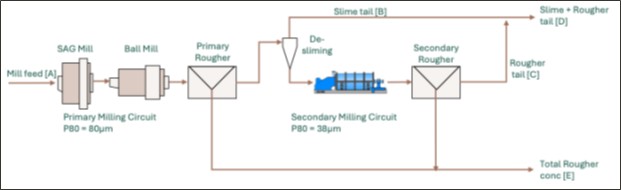
Figure 4: Revised front-end of the circuit showing desliming and mill-float-mill-float (MF2) configuration
De-sliming Efficiency and Mass Rejection
Test work demonstrated a strong linear relationship (R² = 0.691) between the mass fraction and copper grade in the de-slime fraction (see Figure 5). At a target grade of
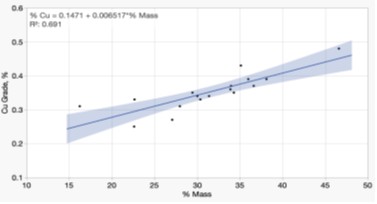
Figure 5: Linear relationship between deslime mass fraction and Cu grade of deslime fraction
Comminution Circuit Power Saving
The 2023 FSU contemplated an MF1 circuit comprising a 5.5 MW SAG mill and a 5.5 MW ball mill in closed circuit with cyclones, producing a flotation feed P80 of 45 µm and drawing 4.8 and 5.0 MW respectively. This configuration included a single rougher stage with 50 minutes of residence time, followed by a 2.2 MW regrind mill drawing 1.9 MW. In total, the circuit incorporated 13.2 MW of installed comminution power, with a projected power draw of 11.7 MW.
Under the new configuration, designed for a coarser primary grind target of 80 µm, DRA’s mill sizing indicates that a 3.8 MW SAG mill and 3.8 MW ball mill represent the optimal setup for the primary milling circuit, with projected power draws of 3.3 MW and 3.4 MW, respectively. Following the de-slime step, a new secondary milling circuit (3.0 MW installed, 2.0 MW power draw) will deliver the secondary grind target of 38 µm. In addition, a 1.5 MW regrind mill (1.4 MW projected draw) will regrind the rougher concentrate to a target P80 of 10 µm.
Altogether, the revised comminution circuit is projected to draw just 10.1 MW, representing between
Reagent Scheme Optimization
In parallel with flowsheet improvements, the flotation reagent suite was also optimized to improve both performance and cost-efficiency (see Table 2). Key changes include:
- Replacement of SIBX collector with PAX
- Substitution of A-249 promoter with A-407
- Adjust pH and redox potential in the primary rougher conditioning stage, reducing NaHS dosage
- Elimination of Polypropylene glycol methyl ether (D-250)
- Elimination of n-Dodecyl Mercaptan (NDM)
In the 2023 FSU, flotation reagents accounted for
Table 2: Reagent regimes and contribution to operating costs (updated to 2025 reagent pricing)
| Reagent type | Dosage (g/t) | |
| 2023 Feasibility | 2025 reagent suite (approximate dosages) | |
| Sodium Isobutyl Xanthate (SIBX) | 317 | - |
| Potassium Amyl Xanthate (PAX) | - | 450 |
| A249 promotor | 335 | - |
| A407 propotor | - | 265 |
| Sodium Hydrosulphide (NaHS) | 1089 | 550 |
| Carboxymethyl Cellulose Sodium (CMC) | 138 | 110 |
| Sodium Silicate | 98 | 330 |
| Methyl Isobutyl Carbinol (MiBC) | 33 | 100 |
| Polypropylene glycol methyl ether (D-250) | 75 | - |
| n-Dodecyl Mercaptan (NDM) | 89 | - |
| Contribution to operating cost ($/t milled) | $6.50 | $5.49 |
Enhanced Rougher Recovery
Figure 6 presents the mass pull versus recovery curves from selected MF2 bench-scale flotation tests, shown alongside the 2018 campaign baselines from Test F19 and Test F71.�� A notable step-change is observed at approximately
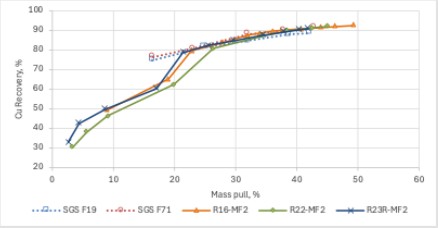
Figure 6: Mass pull versus Recovery curves for MF2 bench tests compared with 2018 SGS baseline
Figure 7 presents linear grade-recovery curves fitted to the secondary rougher flotation data from both the 2018 and 2025 test programs. The fitted models yield R² values of 0.97 for both datasets, indicating a strong correlation between grade and recovery in the secondary rougher stage. The shaded regions represent the
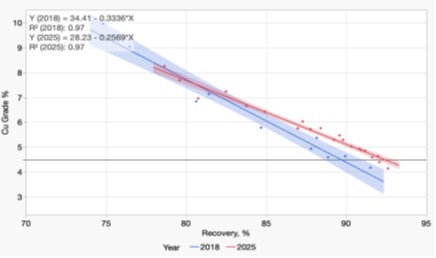
Figure 7: Fitted Grade-Recovery curves for 2025 MF2 rougher tests compared with 2018 SGS baseline
At the target rougher concentrate grade of
Consistent Cleaner Recovery
Bench-scale cleaner optimisation focussed on refining reagent addition rates and evaluating the impact of regrind size on performance. Figure 8 illustrates the grade versus recovery curves from selected 2025 cleaner kinetic tests, presented alongside historical data from the 2018 campaign �� specifically Test F55 and Test F73.��
- Test F55 represented the best cleaner performance under conditions of natural pH and a regrind P80 of 14mm, which was applied during most of the 2018 test work.��
- Test F73 served as the baseline cleaner performance incorporating stagewise NaHS dosages exceeding 2,600 g/t.��
As shown in Figure 8, 2025 cleaner recoveries were comparable to or exceeded those achieved in the 2018 baseline tests, indicating strong and reliable downstream circuit performance. Notably, Test C48, conducted at a regrind P80 of 10µm using the revised 2025 reagent scheme (as detailed in Table 2), delivered cleaner performance outperforming Test F55 and comparable to Test F73.
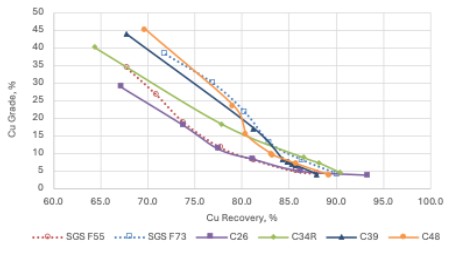
Figure 8: Grade versus Recovery curves for 2025 cleaner kinetic tests compared with 2018 SGS baseline
Underscored by locked cycle tests
While kinetic rate flotation tests, used in the earlier rougher and cleaner optimization work, provide valuable insights, they do not account for the circulating loads that occur in an operating flotation circuit. To better approximate real operating conditions, locked-cycle tests are employed, offering a more realistic measure of recovery, grade, and concentrate mass pull.
Using the test C48 conditions as a basis—but incorporating closed-circuit cleaners—a locked-cycle test (C52) was completed, with results summarized in Table 3. For comparison, the average locked-cycle test results for the Copperwood Main Zone from the 2023 FSU (see Table 13.29) are also shown.
At a comparable copper recovery (
Table 3: Results of locked cycle test C52 using test C37 configuration and closed-circuit cleaners
| Cycle | Mass pull [%] | Grade [%] (Ag = g/t) | Recovery [%] | ||||||
| Cu | Fe | Ag | S | Cu | Fe | Ag | S | ||
| A | 5.5 | 36.2 | 7.3 | 72.3 | 10.5 | 82.9 | 7.5 | 77.2 | 84.9 |
| B | 3.4 | 45.1 | 7.8 | 88.6 | 13.2 | 77.0 | 4.9 | 65.3 | 80.8 |
| C | 4.7 | 37.3 | 7.9 | 69.5 | 10.7 | 78.9 | 6.6 | 66.7 | 87.0 |
| D | 6.8 | 29.8 | 7.3 | 56.5 | 8.6 | 85.6 | 8.7 | 75.8 | 88.3 |
| E | 6.0 | 33.2 | 6.6 | 64.0 | 9.7 | 85.0 | 7.1 | 75.4 | 87.4 |
| F | 5.9 | 32.6 | 6.6 | 61.3 | 9.2 | 85.7 | 7.2 | 74.8 | 89.1 |
| Cycle E+F Average | 5.9 | 32.9 | 6.6 | 62.5 | 9.4 | 85.4 | 7.1 | 75.1 | 88.3 |
| FSU Table 13.29 | 7.3 | 25.1 | �� | 61.2 | �� | 85.8 | �� | 78.8 | �� |
Because test C48 served as the basis for the C52 locked-cycle test, it is reasonable to conclude that the shape of the grade-recovery curve is maintained, but shifted to the right as a result of the closed cleaner circuit. ��The grade-recovery curve for test C48 is shown in Figure 9, together with the balanced grade-recovery curve obtained from locked-cycle test 52. ��At a concentrate grade of
By moving along the locked-cycle grade-recovery curve to a reduced concentrate grade of
Positive Pilot-scale Results for Ultrafine Flotation Technology
Ultrafine flotation technology plays a critical role in recovering very fine particles—typically those smaller than 20 µm—that are often lost in conventional flotation circuits. QEMSCAN analysis of Copperwood ore confirmed that the liberation size of the copper mineralization is sub-20 µm, supporting the historical process design which incorporated a regrind P80 of 14 µm.
The primary objective of evaluating ultrafine flotation at Copperwood is to enhance the grade-recovery curve, a key driver of project economics. In addition, this technology offers potential secondary benefits, including reduced processing plant footprint and a lower environmental impact, aligning with the project's sustainability objectives.
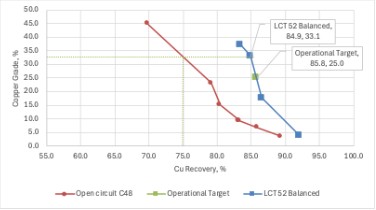
Figure 9: Shift in grade-recovery curve from open circuit to closed circuit locked cycle test
The Jameson Cell, developed by Glencore Technology, was selected for pilot testing. It addresses many of the design and performance limitations of conventional flotation and column cells. With over 500 installations worldwide—including more than 140 in copper circuits—the Jameson Cell is a proven solution, extensively documented in technical literature and industrial case studies.
Following the confirmation of the MF2 circuit configuration and optimized reagent regime through bench-scale testing, the program advanced to the pilot application of ultrafine flotation using a Jameson L150 laboratory unit at Base Met Labs.
Pilot-scale flotation tests, using 40kg batches from the composite sample, were conducted on both the primary and secondary rougher applications, as well as the open circuit cleaner application.�� Prior to each test, a representative sample was extracted from the conditioning tank post-reagent conditioning and subjected to a three-stage dilution test—a standard Glencore Technology method using a D12 Denver bench-top flotation cell. This approach is designed to mimic Jameson Cell conditions and allows for direct comparison of performance and scale-up parameters.
The mass pull versus recovery curve from a primary rougher test, together with a grade versus recovery curve from the corresponding dilution test, is plotted alongside the benchmark MF2 Test R23R in Figure 10. These results demonstrated a distinct and favorable shift in flotation performance with the use of a Jameson Cell, indicating improved kinetics and recovery potential and affirming the value of ultrafine flotation technology in the Copperwood flowsheet.
Table 4 presents a comparative analysis of bench-scale flotation performance achieved during the 2025 testing campaign using conventional flotation cells, versus a configuration utilizing Jameson L150 cells in both the primary and secondary rougher applications. In both scenario’s, the test work employed the revised reagent scheme (as detailed in Table 2) and the MF2 flowsheet configuration (see Figure 4 for stream references). Key observations from the data include:
- The
95% confidence interval for the Rougher Tail mass fraction (stream C) in the conventional cell baseline is18.4% to23.7% with a mean of21.0% . The Jameson cell configuration yielded a significantly higher rougher tail mass fraction of32.0% , a statistically significant difference. This suggests improved selectivity and reduced entrainment in the rougher circuit using ultrafine flotation technology.
Figure 10 is available at
Figure 10: Comparison of L150 Jameson cell mass pull versus recovery curve with 3-stage dilution and 2025 baseline rougher tests.
- The copper grade in the conventional Rougher Tail (stream C) had a
95% confidence interval of0.35% to0.51% Cu, with a mean of0.43% Cu. The Jameson cell circuit achieved a lower tailings grade of0.30% Cu, indicating a statistically significant improvement in rougher recovery. - At a comparable rougher copper recovery of
90% , the Jameson L150 cell produced a rougher concentrate grade of5.4% Cu, compared to the baseline range of4.3% to4.7% Cu (95% confidence interval). This higher concentrate grade is statistically significant and confirms that the ultrafine flotation technology delivers a favorable shift in the rougher grade-recovery curve.��
Table 4: Jameson L150 and bench test comparison on rougher performance (see Figure 4 for circuit configuration)
| Test ID | Type | Avg Calc Feed [A] | Slime Tail [B] | Rougher Tail [C] | Slime+ Rougher Tail [D] | Total Rougher Concentrate [E] | ||||||||
| % Cu | Mass | Grade %Cu | Recovery %Cu | Mass | Grade %Cu | Recovery %Cu | Mass | Grade %Cu | Recovery %Cu | Mass | Grade %Cu | Recovery %Cu | ||
| BL1847-22R | Bench Rougher | 2.25 | 30.4 | 0.33 | 4.5 | 24.65 | 0.33 | 3.62 | 55.0 | 0.33 | 8.1 | 45.0 | 4.6 | 91.9 |
| BL1847-23 | Bench Rougher | 2.25 | 34.3 | 0.35 | 5.3 | 23.87 | 0.44 | 4.67 | 58.2 | 0.39 | 10.0 | 41.8 | 4.8 | 90.0 |
| BL1847-34R | Bench Rougher-Cleaner | 2.25 | 35.1 | 0.43 | 6.7 | 19.34 | 0.35 | 3.01 | 54.5 | 0.40 | 9.7 | 45.5 | 4.5 | 90.3 |
| BL1847-37 | Bench Rougher-Cleaner | 2.25 | 36.0 | 0.39 | 6.2 | 18.94 | 0.49 | 4.13 | 54.9 | 0.42 | 10.4 | 45.1 | 4.5 | 89.6 |
| BL1847-36 | Bench Rougher-Cleaner | 2.25 | 32.8 | 0.37 | 5.4 | 19.71 | 0.46 | 4.03 | 52.5 | 0.40 | 9.4 | 47.5 | 4.3 | 90.6 |
| BL1847-39 | Bench Rougher-Cleaner | 2.25 | 33.6 | 0.46 | 6.9 | 19.69 | 0.51 | 4.47 | 53.3 | 0.48 | 11.3 | 46.7 | 4.3 | 88.7 |
| Bench-test baseline performance | �� | 2.25 | 33.7 | 0.39 | 5.8 | 21.03 | 0.43 | 3.99 | 54.7 | 0.40 | 9.8 | 45.3 | 4.5 | 90.2 |
| BL1847-38 | Jamo L150 | 2.25 | 30.7 | 0.42 | 5.7 | 32.01 | 0.30 | 4.27 | 62.7 | 0.36 | 10.0 | 37.3 | 5.4 | 90.0 |
Encouraged by the improved rougher performance, additional Jameson L150 pilot plant tests were conducted under the MF2 circuit configuration, incorporating both the de-slime circuit and revised reagent regime. The combined primary and secondary rougher concentrates were milled in a pilot ISAMill to a P80 of 15 µm before being fed into an L150 Jameson cell operating in open-circuit primary cleaner duty.
The grade-recovery curve for this “Jamo 53�� test is shown in Figure 11, alongside the open-circuit and locked-cycle test results presented in Figure 9 for comparison. The results clearly demonstrate that the L150 open-circuit test outperformed the C48 baseline. To predict closed-circuit performance, all pilot plant, three-stage dilution, and locked-cycle test results were provided to Glencore Technologies, who incorporated the data into a closed-circuit simulation model.
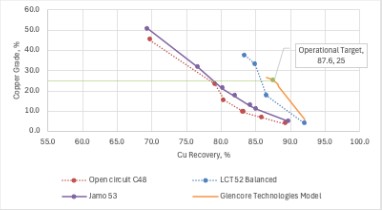
Figure 11: Conventional vs Jameson cell performance in open and closed circuit
The modeled grade-recovery curve for the Jameson cleaner circuit (Figure 11) indicates that at a concentrate grade of
Quality Control:
All metallurgical test work was carried out at Base Metallurgical Laboratories Ltd. (Base Met Labs) in Kamloops, British Columbia. The laboratory maintains rigorous internal quality control protocols to ensure the accuracy and reliability of reported data.�� Base Met Labs participates in the Intertek Global Proficiency Program, conducting regular internal proficiency testing��as part of its quality assurance procedures.
Qualified Person Statement:
The information in this news release relating to metallurgical test work results is based on, and fairly reflects, information reviewed by Dr. Aghil Ojaghi, P.Eng., Senior Process Engineer at DRA for the Copperwood Project and independent from the Company. Dr. Ojaghi is a Qualified Person under National Instrument 43-101 �� Standard of Disclosure for Mineral Projects.�� He is a professional engineer with relevant experience in metallurgical testing and process plant design and has reviewed and approved the technical content as it pertains to his area of responsibility. Dr. Ojaghi consents to the inclusion of this information in the form and context in which it appears.
The overall technical content of this news release has been reviewed and approved by Dr. Wynand van Dyk, a Qualified Person as defined by NI 43-101.�� Dr van Dyk is employed as Project Director by Copperwood Resources Inc, a wholly owned subsidiary of Highland Copper.
About Highland Copper Company:
Highland Copper Company Inc. is a Canadian company focused on exploring and developing copper projects in the Upper Peninsula of Michigan, U.S.A. The Company owns the Copperwood deposit through long-term mineral leases and
More information about the Company is available on the Company’s website at and on SEDAR+ at .
Cautionary Note Regarding Forward-Looking Information:
This news release contains “forward-looking statements�� and “forward-looking information�� (collectively “forward-looking statements��) within the meaning of applicable Canadian securities legislation. These statements include, without limitation, statements with respect to: the potential to advance engineering studies and project optimization at Copperwood, and the anticipated benefits thereof; the completion of lock-cycle variability testing in Q4 2025; completion of process design criteria; and the determination to make a construction decision in 2026. The forward-looking statements are subject to a number of assumptions, including those set out in the technical reports entitled ��Feasibility Study Update Copperwood Project Michigan, USA�� and the Company’s annual information form for the year ended June 30, 2024 (the “AIF��).�� These underlying assumptions may prove to be incorrect. Important factors that could materially impact the Company's expectations include: the results of metallurgical testing in laboratory environments may not be repeated in industrial settings; reagent prices are subject to fluctuations, which may reduce or eliminate expected reagent cost savings; new flow designs may change capital cost requirements, which have not yet been estimated; completion of remaining work programs may not lead to a construction decision; changes in project parameters as plans continue to be refined; availability of services, materials and skilled labour to complete work programs, testing and drilling; effects of regulation by governmental agencies; the fact that permit extensions, renewals and amendments are subject to regulatory approvals, which may be conditioned, delayed or denied; advancement to a construction decision at Copperwood is subject to additional studies, for which the Company will require additional funds, which may not be available on a timely basis and accordingly could delay a construction decision; the Company will be required to repay the loan facility from Kinterra in July, 2026, or will have its interest at White Pine diluted; unexpected cost increases, which could include significant increases in estimated capital and operating costs and the effects of inflation; fluctuations in metal prices and currency exchange rates; general market and industry conditions, the results of baseline studies and test work may result in unforeseen issues which could delay or hamper advancement of the projects, and the other risks set out in the Company’s public disclosure documents, including the AIF, ��filed on SEDAR+.�� Although the Company believes that the assumptions and factors used in preparing the forward-looking statements in this news release are reasonable, undue reliance should not be placed on forward looking statements.�� All forward-looking statements in this press release are based on information available to the Company as of the date hereof, and the Company undertakes no obligation to update forward-looking statements except as required by law.
Neither the TSX Venture Exchange nor its Regulation Services Provider (as that term is defined in the policies of the TSX Venture Exchange) accepts responsibility for the adequacy or accuracy of this release.
For further information or media requests, please contact:
Barry O’Shea, CEO
Email: ����
Website:
1 See “Feasibility Study Update Copperwood Project Michigan, USA�� with an Effective Date of March 6, 2023, prepared for the Company by G Mining Services Inc. available under the Company’s profile at www.sedarplus.com
2 The SGS report entitled “Optimization Flotation Testwork on Material from the Copperwood Deposit��, Project 16256-002-Final Report, August 28, 2018 forms the baseline used in the previous process design, and is discussed in the 2023 Feasibility Study (FSU) for the Copperwood project.
Photos accompanying this announcement are available at
