Laser Photonics Reports Q2 2025 Revenue Growth of 317% Year-Over-Year
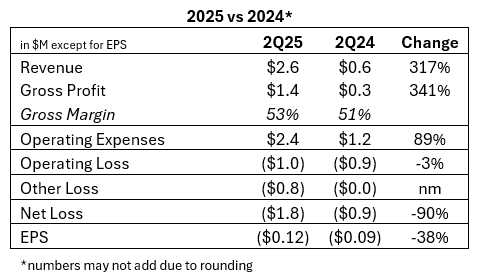
Laser Photonics (NASDAQ:LASE) reported exceptional growth in Q2 2025, with revenue surging 317% to $2.6 million compared to Q2 2024. The company achieved a gross profit increase of 341% to $1.4 million, with improved gross margins of 53.5%.
The growth was driven by strategic acquisitions, including the successful integration of Control Micro Systems (CMS) and the announced acquisition of Beamer Laser Marking Systems, which historically generated $3+ million in annual revenue. The company implemented $2 million in annualized cost reductions during the quarter while securing significant customer wins, including orders from a Fortune 500 appliance manufacturer and the Massachusetts Bay Transportation Authority through W.W. Grainger.
Laser Photonics (NASDAQ:LASE) ha registrato una crescita eccezionale nel secondo trimestre 2025, con ricavi in aumento del 317% a 2,6 milioni di dollari rispetto al Q2 2024. L'utile lordo è cresciuto del 341% raggiungendo 1,4 milioni di dollari, con un miglioramento del margine lordo al 53,5%.
La crescita è stata guidata da acquisizioni strategiche, tra cui l'integrazione riuscita di Control Micro Systems (CMS) e l'annunciata acquisizione di Beamer Laser Marking Systems, che in passato generava oltre 3 milioni di dollari di ricavi annuali. Durante il trimestre la società ha implementato riduzioni dei costi annualizzate per 2 milioni di dollari e ha ottenuto importanti commesse da clienti, tra cui un produttore di elettrodomestici appartenente alla Fortune 500 e la Massachusetts Bay Transportation Authority tramite W.W. Grainger.
Laser Photonics (NASDAQ:LASE) informó un crecimiento excepcional en el segundo trimestre de 2025, con ingresos que se dispararon un 317% hasta 2,6 millones de dólares respecto al Q2 de 2024. El beneficio bruto aumentó un 341% hasta 1,4 millones de dólares, con márgenes brutos mejorados del 53,5%.
El crecimiento estuvo impulsado por adquisiciones estratégicas, incluida la integración exitosa de Control Micro Systems (CMS) y la anunciada compra de Beamer Laser Marking Systems, que históricamente generaba más de 3 millones de dólares anuales. La compañía implementó durante el trimestre reducciones de costos anualizadas por 2 millones de dólares y consiguió importantes pedidos de clientes, entre ellos un fabricante de electrodomésticos del Fortune 500 y la Massachusetts Bay Transportation Authority a través de W.W. Grainger.
Laser Photonics (NASDAQ:LASE)�� 2025�� 2분기�� 예외적인 성장�� 보였으며, 매출�� 전년 동기 대�� 317% 증가�� 260�� 달러�� 기록했습니다. 총이익은 341% 증가�� 140�� 달러�� 개선되었��, 총마진은 53.5%�� 향상되었습니��.
성장은 Control Micro Systems(CMS)�� 성공�� 통합�� 과거 연간 매출�� 300�� 달러 이상이었�� Beamer Laser Marking Systems�� 인수 발표 �� 전략�� 인수�� 힘입은 것입니다. 회사�� 분기 중에 연간화된 200�� 달러�� 비용 절감�� 실행했으��, Fortune 500 가�� 제조업체와 W.W. Grainger�� 통한 Massachusetts Bay Transportation Authority �� 주요 고객으로부�� 수주�� 확보했습니다.
Laser Photonics (NASDAQ:LASE) a enregistré une croissance exceptionnelle au T2 2025, avec un chiffre d'affaires en hausse de 317% à 2,6 millions de dollars par rapport au T2 2024. Le bénéfice brut a augmenté de 341% pour atteindre 1,4 million de dollars, avec une marge brute améliorée à 53,5%.
La croissance a été portée par des acquisitions stratégiques, notamment l'intégration réussie de Control Micro Systems (CMS) et l'acquisition annoncée de Beamer Laser Marking Systems, qui générait historiquement plus de 3 millions de dollars de revenus annuels. La société a mis en œuvre au cours du trimestre des réductions de coûts annualisées de 2 millions de dollars et a remporté des commandes importantes, notamment d'un fabricant d'appareils électroménagers du Fortune 500 et de la Massachusetts Bay Transportation Authority via W.W. Grainger.
Laser Photonics (NASDAQ:LASE) verzeichnete im zweiten Quartal 2025 ein außergewöhnliches Wachstum: der Umsatz stieg um 317% auf 2,6 Mio. USD gegenüber Q2 2024. Der Bruttogewinn erhöhte sich um 341% auf 1,4 Mio. USD, bei verbesserten Bruttomargen von 53,5%.
Treiber des Wachstums waren strategische Übernahmen, darunter die erfolgreiche Integration von Control Micro Systems (CMS) und die angekündigte Übernahme von Beamer Laser Marking Systems, die historisch mehr als 3 Mio. USD Jahresumsatz erzielte. Das Unternehmen setzte im Quartal annualisierte Kostensenkungen in Höhe von 2 Mio. USD um und sicherte sich bedeutende Aufträge, unter anderem von einem Fortune��500‑Haushaltsgerätehersteller und der Massachusetts Bay Transportation Authority über W.W. Grainger.
- Revenue growth of 317% year-over-year to $2.6 million
- Gross profit increased 341% with improved margins of 53.5%
- Strategic acquisition of Beamer Laser Systems adding $3+ million in historical annual revenue
- Implementation of $2 million in annualized cost reductions
- Significant customer wins including Fortune 500 companies
- Expanded distribution network through Beamer's 19 tech centers and 5 demonstration showrooms
- Reported net loss with $0.8 million in interest expense
- Increased operating expenses from acquired companies
- Integration costs from multiple acquisitions impacting short-term profitability
Insights
LASE shows remarkable 317% revenue growth with strategic acquisitions driving expansion, though still operating at a loss despite cost-cutting measures.
Laser Photonics delivered extraordinary revenue growth of
Gross profit saw an even more impressive jump of
The
The strategic acquisition of CMS (completed in Q4 2024) is already showing returns through significant customer wins, including contracts with a Fortune 500 appliance manufacturer and a global manufacturing services provider. The more recent Beamer Laser Marking Systems acquisition (announced June 2025) adds another
While the revenue growth trajectory is impressive, investors should monitor whether the cost-cutting measures and growing scale will translate to profitability in upcoming quarters. The significant interest expense suggests debt burdens that could continue to pressure bottom-line results despite operational improvements.
Revenue Surges to
Implemented
ORLANDO, FLORIDA / / August 18, 2025 / Laser Photonics Corporation (NASDAQ:LASE), ("LPC"), $LASE, a leading global developer of CleanTech laser systems for laser cleaning and other material applications, today announced results for its second quarter ended June 30, 2025.
Q2 2025 Financial Highlights (versus Q2 2024):
Revenue increased
317% to$2.6 million compared to$0.6 million Gross profit expanded
341% to$1.4 million with gross margins improving to53.5% Successfully implemented plan to reduce
$2 million in annualized expenses during the quarterNet loss included approximately
$0.8 million in interest expense classified under "Other Income (Loss) compared to$0.
Wayne Tupuola, CEO of Laser Photonics, commented:
"Q2 demonstrated the accelerating momentum of our strategic transformation, with revenue growth exceeding
"Equally important, we delivered on our commitment to operational discipline by implementing
Carlos Sardinas, Chief Financial Officer of Laser Photonics, added:
"Our Q2 financial performance reflects the successful execution of our dual strategy of growth acceleration and operational efficiency. Additionally, this quarter's results included the incremental headcount from the CMS acquisition, which closed in Q4 last year. The
Business Highlights
Strategic Acquisitions & Integration: Building on the successful CMS acquisition completed in Q4 2024, Laser Photonics announced the strategic acquisition of Beamer Laser Marking Systems in June 2025. Beamer's historical performance of
CMS Continued Success: Control Micro Systems secured significant orders from a Fortune 500 home appliance manufacturer and a premier global manufacturing services provider, highlighting the division's expertise in custom-engineered laser marking solutions. These wins demonstrate CMS's proven ability to deliver exceptional value to industry leaders across diverse sectors including precision manufacturing and high-reliability OEM markets.
CleanTech Industrial Expansion: Laser Photonics received an order for its CleanTech Industrial Roughening Laser 3040 (CTIR-3040) through W.W. Grainger for use by the Massachusetts Bay Transportation Authority (MBTA). This strategic win validates the technology's effectiveness in transportation infrastructure applications and strengthens LPC's relationship with Grainger's extensive distribution network serving 4.5 million customers worldwide.
Operational Excellence: The Company successfully implemented
About Laser Photonics Corporation
Laser Photonics is a vertically integrated manufacturer and R&D Center of Excellence for industrial laser technologies and systems. Laser Photonics seeks to disrupt the
Cautionary Note Concerning Forward-Looking Statements
This press release contains "forward-looking statements" (within the meaning of Section 27A of the Securities Act of 1933, as amended, and Section 21E of the Securities Exchange Act of 1934, as amended), including statements regarding the Company's plans, prospects, potential results and use of proceeds. These statements are based on current expectations as of the date of this press release and involve a number of risks and uncertainties, which may cause results and uses of proceeds to differ materially from those indicated by these forward-looking statements. These risks include, without limitation, those described under the caption "Risk Factors" in our Form 10-K for the fiscal year ended December 31, 2024. Any reader of this press release is cautioned not to place undue reliance on these forward-looking statements, which speak only as of the date of this press release. The Company undertakes no obligation to revise or update any forward-looking statements to reflect events or circumstances after the date of this press release except as required by applicable laws or regulations.
Laser Photonics Investor Relations Contact:
Brian Siegel, IRC, MBA
Senior Managing Director
Hayden IR
(346) 396-8696
[email protected]
CONDENSED CONSOLIDATED BALANCE SHEETS
(in thousands, except par value data)
(unaudited)
As of June 30, 2025 (Unaudited) | As of December 31, 2024 (Audited) | |||||||
Assets | ||||||||
Current Assets: | ||||||||
Cash and Cash Equivalents | $ | 78,522 | $ | 533,871 | ||||
Accounts Receivable, Net | 877,522 | 973,605 | ||||||
Contract Assets | 657,103 | 759,658 | ||||||
Inventory | 1,476,637 | 2,338,759 | ||||||
Other Assets | 256,118 | 58,567 | ||||||
Total Current Assets | 3,345,902 | 4,664,460 | ||||||
Property, Plant, & Equipment, Net | 1,652,952 | 1,872,034 | ||||||
Intangible Assets, Net | 5,138,861 | 5,458,522 | ||||||
Other Long Term Assets | 316,378 | 316,378 | ||||||
Operating Lease Right-of-Use Asset | 4,486,758 | 4,840,753 | ||||||
Total Assets | $ | 14,940,851 | $ | 17,152,147 | ||||
Liabilities & Stockholders' Equity | ||||||||
Current Liabilities: | ||||||||
Accounts Payable | $ | 1,484,062 | $ | 531,268 | ||||
Account payable - affiliates/RP | 126,739 | 27,988 | ||||||
Short term loan | 1,210,923 | - | ||||||
Short term loan - affiliates/ RP | 620,000 | - | ||||||
Deferred Revenue | 319,872 | 55,383 | ||||||
Contract Liabilities | 1,577,417 | 1,042,090 | ||||||
Current Portion of Operating Lease | 440,468 | 649,989 | ||||||
Accrued Expenses | 562,342 | 266,717 | ||||||
Total Current Liabilities | 6,341,823 | 2,573,435 | ||||||
Long Term Liabilities: | ||||||||
Lease liability - less current | 4,262,061 | 4,366,419 | ||||||
Total Long Term Liabilities | 4,262,061 | 4,366,419 | ||||||
Total Liabilities | 10,603,884 | 6,939,854 | ||||||
Stockholders' Equity: | ||||||||
Preferred stock Par value | - | - | ||||||
Common Stock Par Value | 14,276 | 14,257 | ||||||
Additional Paid in Capital | 15,565,439 | 17,886,159 | ||||||
Retained Earnings (Deficit) | (11,208,938 | ) | (7,754,313 | ) | ||||
Shares to be issued | - | 100,000 | ||||||
Treasury Stock | (33,810 | ) | (33,810 | ) | ||||
Total Stockholders' Equity | 4,336,967 | 10,212,293 | ||||||
Total Liabilities & Stockholders' Equity | $ | 14,940,851 | $ | 17,152,147 | ||||
STATEMENTS OF PROFIT AND LOSS
(in thousands, except per share data)
(unaudited)
3 Months Ended | 6 Months Ended | |||||||||||||||
June 30,2025 (Unaudited) | June 30, 2024 (Unaudited) | June 30,2025 (Unaudited) | June 30, 2024 (Unaudited) | |||||||||||||
Net Sales | $ | 2,598,975 | $ | 623,435 | $ | 4,889,257 | $ | 1,366,426 | ||||||||
Cost of Sales | 1,208,871 | 308,081 | 2,359,387 | 665,204 | ||||||||||||
Gross Profit | 1,390,104 | 315,354 | 2,529,870 | 701,222 | ||||||||||||
Operating Expenses: | ||||||||||||||||
Sales & Marketing | 256,635 | 266,282 | 874,334 | 402,891 | ||||||||||||
General & Administrative | 697,265 | 435,776 | 1,597,299 | 792,042 | ||||||||||||
Depreciation & Amortization | 339,123 | 245,894 | 576,134 | 431,210 | ||||||||||||
Payroll Expenses | 928,482 | 238,703 | 1,769,343 | 447,158 | ||||||||||||
Research and Development Cost | 131,287 | 60,232 | 247,973 | 107,923 | ||||||||||||
Total Operating Expenses | 2,352,792 | 1,246,887 | 5,065,083 | 2,181,224 | ||||||||||||
Operating Income (Loss) | (962,688 | ) | (931,533 | ) | (2,535,213 | ) | (1,480,002 | ) | ||||||||
Other Income (Expense): | ||||||||||||||||
Interest Expense | (813,400 | ) | ||||||||||||||
Other Income | 2,186 | |||||||||||||||
Total Other Income (Loss) | (811,214 | ) | (2,723 | ) | (919,412 | ) | 37 | |||||||||
Income (Loss) Before Tax | (1,773,902 | ) | (934,256 | ) | (3,454,625 | ) | (1,479,965 | ) | ||||||||
Tax Provision | - | - | - | - | ||||||||||||
Net Income (Loss) | $ | (1,773,902 | ) | $ | (934,256 | ) | $ | (3,454,625 | ) | $ | (1,479,965 | ) | ||||
Deemed Dividend from Software Acquisition | (6,615,000 | ) | (6,615,000 | ) | ||||||||||||
Net Comprehensive loss attributed to Common Shareholders | (1,773,902 | ) | (7,549,256 | ) | (3,454,625 | ) | (8,094,965 | ) | ||||||||
Earning (Loss) per Share: | ||||||||||||||||
Basic and diluted | $ | (0.12 | ) | $ | (0.09 | ) | $ | (0.24 | ) | $ | (0.15 | ) | ||||
Loss per share (attributable to common shareholders) | (0.12 | ) | (0.71 | ) | (0.24 | ) | (0.82 | ) | ||||||||
Weighted Average of Shares Outstanding | 14,276,150 | 10,589,108 | 14,273,878 | 9,924,908 | ||||||||||||
Statement of Cash Flows
(in thousands)
(unaudited)
2025 (Unaudited) | 2024 (Unaudited) | |||||||
OPERATING ACTIVITIES | ||||||||
Net Loss/Gain | $ | (3,454,625 | ) | $ | (1,479,965 | ) | ||
Adjustments to Reconcile Net Loss to Net Cash Flow from Operating Activities: | ||||||||
Bad Debt | 7,655 | - | ||||||
Debt discount amortization | 71,008 | - | ||||||
Shares issued for compensation | 33,336 | |||||||
Distribution to affiliate | (2,420,701 | ) | (2,198,993 | ) | ||||
Depreciation & Amortization | 576,134 | 431,210 | ||||||
Change in Operating Assets & Liabilities: | ||||||||
Accounts Receivable | 88,429 | 370,348 | ||||||
Contract Assets | 102,555 | - | ||||||
Inventory | 847,289 | 132,034 | ||||||
Prepaids & Other Current Assets | (197,553 | ) | (366,448 | ) | ||||
Net Change, Right-of-Use Asset & Liabilities | 40,118 | - | ||||||
Accounts Payable | 1,051,545 | (24,804 | ) | |||||
Contract Liabilities | 535,327 | - | ||||||
Accrued Expenses | 295,625 | (53,924 | ) | |||||
Deferred Revenue | 264,490 | (96,550 | ) | |||||
Net Cash Used in Operating Activities | (2,192,704 | ) | (3,253,756 | ) | ||||
INVESTING ACTIVITIES | ||||||||
Purchase of Property, Plant an Equipment | - | (12,934 | ) | |||||
Purchase of Research & Development Equipment | (6,900 | ) | (4,095 | ) | ||||
Leasehold Improvements | (15,660 | ) | (182,719 | ) | ||||
Net Cash Used in Investing Activities | (22,560 | ) | (199,748 | ) | ||||
FINANCING ACTIVITIES | ||||||||
IPFS Loan | (29,458 | ) | - | |||||
Borrowings on debt | 2,550,000 | - | ||||||
Borrowings on debt | (1,380,627 | ) | - | |||||
Short term Loan From Affiliate | 620,000 | - | ||||||
Common stock .01 x 100,000,000 | - | (92,533 | ) | |||||
Common stock .001 x 100,000,000 | - | 12,253 | ||||||
Additional Paid in Capital | - | 80,280 | ||||||
Net Cash provided by (used in) Financing Activities | 1,759,915 | - | ||||||
Net Cash Flow for Period | (455,349 | ) | (3,453,504 | ) | ||||
Cash and Cash Equivalents - Beginning of Period | 533,871 | 6,201,137 | ||||||
Cash and Cash Equivalents- End of Period | $ | 78,522 | $ | 2,747,633 | ||||
NON-CASH INVESTING AND FINANCING ACTIVITIES | ||||||||
Shares issued for Investment | 100,000 | - | ||||||
Transfer demo inventory to PPE | 14,833 | - | ||||||
Share issued for purchase of license | - | 6,615,000 | ||||||
SOURCE: Laser Photonics Corp.
View the original on ACCESS Newswire